Guideline for the development of Integrated Waste Management Plans (IWMP)
Executive Summary
The development of an Integrated Waste Management Plan (IWMP) is a requirement for all government spheres responsible for waste management in terms of the National Environmental Management: Waste Act, 2008 (Act No. 59 of 2008) (hereinafter referred to as the “Waste Act’’) for government to properly plan and manage waste. These guidelines have been written to follow the waste handling process in accordance with the waste management hierarchy. This implies that Integrated Waste Management Plans (IWMP’s) should include all aspects of the waste management hierarchy. The guidelines provide a background for the compilation of Integrated Waste Management Plans which includes a short historical overview of IWMP’s to date and a basic description of the legal framework pertaining to IWMP development.
The development of an IWMP includes a situation analysis which includes a description of the population and development profiles of an area to which the plan relates, an assessment of the quantities and types of waste types that are generated in that area, a description of the services that are provided or that are available for the collection, minimisation, re-use, recycling, and recovery, treatment and disposal of waste and lastly it must include the number of persons in the area who are not receiving waste collection services. Furthermore the situation analysis must also be completed in terms of institutional, financial, political, legal and physical conditions which must also be translated into the desired end state.
Once the situation analysis has been completed a municipality must then define the desired end state for the overall management of waste. The desired end state sets out the goals and targets to achieve in the implementation of the IWMP. The desired end state should be completed in terms of institutional, financial, political, legal and physical conditions. All of these should be in relation to the situation analysis and goals and targets should have a target date by which they will be attained which is normally five years from the date the plan has been adopted.
The next section in the IWMP deals with the identification of alternatives to achieve the goals and targets that have been set in the desired end state. The identified alternatives should then be evaluated to assess environmental, technical, social, financial, institutional and organisational arrangements and impacts. The evaluation of alternatives will inform municipalities on choosing the best alternative to achieve its goals and targets set during the desired end state. It is crucial to develop an implementation plan for the implementation of an IWMP. This section must include a concise and clear description of instruments that will be used for implementing the IWMP. It must describe how institutional and organisational matters; financial matters; education and training and management of assets will be addressed in order to reach the goals and targets.
Performance assessment is the last step in the IWMP process, although this happens outside the development of the plan. Section 13 (3) of the Waste Act requires that annual performance reports be prepared in terms of section 46 of the Municipal Systems Act (MSA) and must contain information on the implementation of the municipal IWMP, including the information set out in paragraph (a) to (j) of subsection (2) insofar as it relates to the performance of the municipality.
List of figures
List of boxes
List of tables
List of graphs
List of acronyms
CBO - Community Based Organisations
DEA - Department of Environmental Affairs
DWA - Department of Water Affairs (Previously known as DWAF)
EHP's - Environmental Health Practitioners
EIA - Environmental Impact Assessment
GIS - Geographical Information System
IDP's - Integrated Development Plans
IndWMP's - Industry Waste Management Plans
IWMP – Integrated Waste Management Plan/s
MFMA- Municipal Finance Management Act, no 56 of 2003 MIG- Municipal Infrastructure GrantMEC - Member of Executive Council
MSA - Municipal Systems Act (Act no. 32 of 2000)
NEMWA - National Environmental Management: Waste Act (Act No. 59 of 2008)
NGO - Non-Governmental Organisation/s
NWMS - National Waste Management Strategy
SAWIC-South African Information CentreUNEP - United Nations Environment Programme
WEEE - Waste of Electric and Electronic Equipment
WIS - Waste Information System
WMO - Waste Management Officer
1. Introduction
South Africa has come a long way with regards to the management of waste. Historically, waste was managed by various pieces of legislation that were governed by different government departments and which were often fragmented in nature resulting in gaps and poor waste management practices. The promulgation of the Waste Act (Act No. 59 of 2008) on 1 July 2009 was a key milestone in consolidating waste legislation in a bid to have common goals and understanding of how the country's waste should be managed.
The Waste Act adopts the waste management hierarchy approach to dealing with and addressing waste issues in the country, where the emphasis is on waste reduction, if not possible re-use, recycling and composting, recovery to create energy, with disposal as a last resort as illustrated on figure 1.
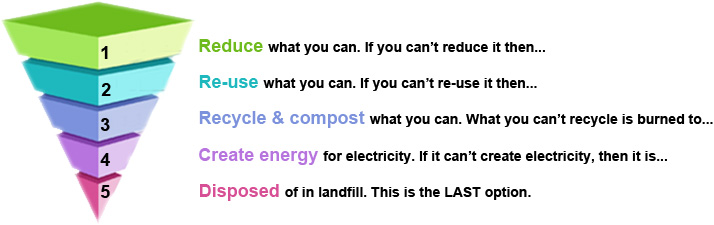
Figure 1: Waste Management Hierarchy
In developing IWMP's all three spheres of government are required to follow the waste management hierachy approach as depicted in Figure 1 above where possible.
1.1 Historical overview in the development of IWMP's
The development of IWMPs is not a new concept as many municipalities and Provinces developed what is termed 'first generation IWMPs' in accordance with the 1999 National Waste Management Strategy (NWMS). The development of first generation IWMPs was however not a mandatory requirement as there was no environmental legislation to call for the development of these and as such; they could not be enforced. The result was that first generation IWMPs had little or no success with implementation since it was on a voluntary basis.
The development of IWMPs is now mandatory as stipulated in the Waste Act; therefore in trying to assist municipalities to develop their IWMPs the Department of Environmental Affairs (DEA) developed this guideline. The Waste Act requires that Municipalities must integrate their IWMPs into the Integrated Development Plans (IDPs) in order to ensure that waste management services are streamlined with other essential basic services such as water and sanitation, housing, and electricity provision. This is to ensure that waste management should receive a share from the equitable share funding allocation and municipalities should ensure that waste services will be properly budgeted to ensure sustainability in the delivery of waste management services. Further, Municipalities are required to include the implementation of their IWMPs in their annual performance reports.
1.2 Legislative requirements
The Waste Act: (Act No. 59 of 2008)
Chapter 3, section 11 of the Waste Act requires that all government spheres must develop Integrated Waste Management Plans (IWMPs). Section 12 of the Waste Act outlines what the contents of integrated waste management plans should be, whilst section 13 stipulates the reporting mechanisms on the implementation of IWMP's.
In terms of section 11 (4) (a) (ii) of the Waste Act, municipalities must incorporate the approved IWMP in their IDP's as called for by chapter 5 of Municipal Systems Act, 2000 (Act 32 of 2000) MSA. Chapter 5, sections 23-37 of MSA deals with the process of developing Integrated Development Plans. Section 36 of the MSA states that, a municipality must give effect to its IDP and conduct its affairs in a manner which is consistent with its IDP. This means that the development and implementation of the IWMP must be aligned with the IDP.
Waste is managed by different pieces of legislation such as the National Water Act, (Act 36 of 1998); Hazardous Substances Act, (Act 15 of 1973); Advertising on Roads and Ribbon Development Act (Act 21 of 1940); and the Occupation and Safety Act (Act no 85 of 1993). Other applicable policies and standards including municipal by-laws are listed below which should be considered when developing an IWMP:
Regulations in terms of the Waste Act:
- National Waste Information regulations
- National Waste Classification and Management System regulations
- Remediation of contaiminated land
- Standards for soil quality
The National Waste Management Strategy (NWMS)
Gazetted by DEA in 2012, aims at giving effect to the objects of the Waste Act. Municipalities are required to align their IWMP's to the NWMS tagerts where possible in order to contribute to the attainment of the goals and targets set in the NWMS.
The South African Constitution, 1996 (Act 108 of 1996)
Section 24 of the Bill of rights of the Constitution of South Africa clearly states that everyone has the right to:
- An environment that is not harmful to their health or well-being; and
- Should have the environment protected, for the benefit of present and future generations, through reasonable legislative and other measures that:
- prevent pollution and ecological degradation;
- Promote conservation; and
- Secure ecologically sustainable development and use of natural resources while promoting justifiable economic and social development
The Constitution places an emphasis on the need to have the environment protected for the benefit of present and future generations through reasonable legislative and other measures i.e. IWMP. It is within this provision that IWMPs must strive or come up with measures to uphold the rights of all citizens within the jurisdiction of the municipality and should enhance and promote environmental protection from any form of degradation as enshrined by the South African Constitution.
National Domestic Waste Collection Standards, January 2011
The main purpose of these standards is to redress past imbalances in the provision of waste collection services, whereby it has become imperative that acceptable, affordable and sustainable waste collection services be rendered to all South Africans. The provision of waste collection services will improve the quality of life of citizens and will ensure that citizens live in a clean and more acceptable environment. The lack of waste collection services or poor quality waste collection services can result in a number of environmental and human health problems and therefore proper planning is crucial.
National Policy for the Provision of Basic Refuse Removal Services to Indigent Households
This policy provides for the provision of basic refuse removal for Indigent households. The policy defines basic refuse removal service level as the most appropriate level of waste removal service that should be provided and this is based on site specific circumstances. Such a basic level of service be it in an urban or rural set-up, is attained when a municipality provides or facilitates waste removal. The policy further outlines the appropriate levels of service for different settlement densities, frequency of collection and provision of waste receptacles amongst others.
National Environment Management Act, (Act 107 of 1998) NEMA
NEMA is the mother of all environmental management Acts in South Africa. The purpose of NEMA is to uphold the provisions of section 24 of the Bill of rights (The Constitution of the Republic of South Africa). It aims to promote and uphold the rights of South African citizens to live in an environment that is not harmful to its health or well-being.
It places sustainable development at the centre of every development process that has the potential to have an impact on social, economic and environment whereby it requires the integration of social, economic and environmental factors in the planning, implementation and evaluation of decisions to ensure that development serves present and future generations.
Municipal Systems Act, 2000 (Act 32 of 2000)
In terms of Section 25 of the MSA each municipal council must, within a prescribed period after the start of its elected term, adopt a single, inclusive and strategic plan (IDP) for the development of the municipality. In relation to waste management, the IDP is required to include sectoral environmental plans which would be an IWMP for waste management. In their IDP's municipalities are required to ensure proper resource allocation to achieve the targets set in the respective plans.
National Health Act, 2000 (Act 63 of 1977)
Section 20 of this Act requires that 'every local authority shall take all lawful, necessary and reasonable practicable measures to maintain its district at all times in a hygenic and clean condition' by ensuring the following:
- To prevent occurences within its destrict if:
- Any nuisance
- Any un-hygenic conditions
- Any offensive condition
- Any other condition which will or could be harmful or dangerous to the health of any person within its district or the district of any other local authority or where nuisance or conditions referred to in sub-paragraph (a)-(d), inclusive has so occurred, to be abated, such nuisance or remedy or cause to be remedied, such as the case may be.
1.3 The role of a Waste Management Officer (WMO)
The designation of a waste management officer (WMO) at a municipal level is important in order to ensure that there is constant communication between all three spheres of government on the implementation of the Waste Act. In relation to the development of IWMP, a WMO could potentially play a critical role in ensuring that a municipality should develop its IWMP for compliance purposes. Chapter 3, Section 10(3) of the Waste Act requires that the National Department, Provinces and Municipalities designate WMOs in writing. The Department has developed a guideline on designation of a WMO which contains information on the duties of a WMO as well as the delegations of power and engagements with other WMOs. The Local government sphere WMOs will act as a point of contact between other spheres of government on waste management issues. This includes the development and implementation of IWMPs which will assist Provinces or the National department in obtaining any information pertaining to the implementation of the IWMP’s i.e. reporting on a municipality’s progress with regards to reaching its targets as per the IWMP, as well as ensuring that a municipality includes IWMP reporting in the annual performance reports as called for by the (Municipal Systems Act) MSA.
1.4 IWMP planning process
The primary objective of IWMPs is to integrate and optimise waste management planning in order to maximise efficiency and minimise the associated environmental impacts and financial costs, and to improve the quality of life for all South Africans. The diagram below (figure 2) summarises the integrated waste management planning process.
Figure 2: Integrated Waste Management Planning Process
As depicted in figure 2 above, the integrated waste management planning process includes the following:
- Establishing the situation analysis which includes backlogs;
- Setting the desired end state;
- Identifying, evaluating and selecting alternative methods/approaches for achieving the desired end state;
- Implementing the integrated waste management plan; and
- Evaluating and reviewing the plan to ensure the respective objectives are being met.
As part of the IWMP development process, section 13 of the Waste Act requires the development of annual performance reports and it must be noted that this happens outside the actual IWMP development process. Section 13 (3) of the Waste Act states that annual performance report must be prepared in terms of section 46 of the Municipal Systems Act and must contain information on the implementation of the municipal IWMP, including the information set out in paragraph (a) to (j) of subsection (2) insofar as it relates to the performance of the municipality.
2. Contents of the IWMP's
2.1 Defining the geographical area
Prior to developing a situation analysis, a municipality must define the geographical area to which the plan relates. This involves describing the total area in square meters, the municipalities under the municipality in a case of a district municipality or towns in a case of a local municipality, available infrastructure such as roads as well as brief information about the socio-economic status of the area i.e. it is predominantly rural, with very high levels of un-employment and poverty, the major economic activities include agriculture and mining etc. Wards under the municipality should also be indicated. Where possible a map depicting the areas described under this section should be included.
2.2 Situation analysis
The main objective of a situation analysis is to analyse and quantify all aspects pertaining to the management of waste within a particular municipality’s boundary (including all types of settlements). It includes the current status with regards to the delivery of waste services, number of residents in that municipality, demographic profile and socio-economic composition. It also includes the amount and type of waste that is being generated, recycled, recovered, treated and disposed. Information on resources i.e. financial and human capital including equipment must also be indicated under this section. Chapter 3 section 12 of the Waste Act stipulates that a situation analysis must at least include the following:
- A description of the population and development profiles of the area to which the plan relates;
- An assessment of the quantities and types of waste that are generated in the area;
- A description of the services that are provided, or that are available, for the collection, minimisation, re-use, recycling, and recovery, treatment and disposal of waste, and
- The number of persons in the area who are not receiving waste collection services
2.2.1 Demographics (population and development profiles)
Demographics can be defined as the most recent statistical characteristics of a population in a given area at a specified time1. The most commonly examined demographics include gender, race, age, economic and social status/profile, number of households and their distribution, poverty levels, education and employment status amongst others.
In relation to waste management, demographics are required to develop projections of current and future waste quantities. In addition this information is required to:
- Ensure that previously un-serviced areas, such as informal settlements and rural or sparsely populated areas are considered;
- Form the basis for projected waste volumes and types;
- Evaluate potential for financial recovery; and
- Assess the required resources to provide waste management services and infrastructure.
The following box provides demographic data/information sources.
Box 1: Example of demographic data sources
Tips on sources of demographic information:
|
Demography also includes fertility, mortality and migration rates. Therefore it is important to also feature in the birth and death rates of the area, how migration in the area is affecting the socio-economic; environment and development dimension patterns of that area.
Information on South Africa's demographics is collected by StatsSA during the Census data collection phase and it is classified according to settlement types. The settlement types are classified according to the following categories:
- High income, low density; 2
- Middle income, middle density;3
- Low income, high density4 (including informal settlements) and
- Rural settlements.
In presenting the description of population and development profile of an area, a municipality must also indicate the population growth estimates of that particular area.
Growth Estimates are available in the latest Mid-year growth Estimate report from StatsSA. Municipalities could make use of the formula supplied in this report to do their calculations. In instances where this information is not readily available, it can then be calculated as follows:
Pt = P0 + B - D + I - E ÷ N
Where Pt represents the current population,
P0 represents the base resident population,
B represents births to resident,
D represents deaths to residents,
I represents immigrants,
E represents emigrants and
N represents number of years
In the equation, the population changes by adding births and immigrants and subtracting deaths and emigrants.
Pt = P0 + B - D + I - E ÷ N
100 000=70 000+20 000-6000+3000-1000 ÷ 10
100 000=90 000-6 000+3 000-1000 ÷ 10
100 000=84 000+3 000-1000 ÷ 10
100 000=87 000-1000 ÷ 10
100 000=86 000 ÷ 10
=8.6% in 10 yrs
=8.6 ÷ 10
=0.86% annually
In this particular area/case6:
Settlement type: High income, low density
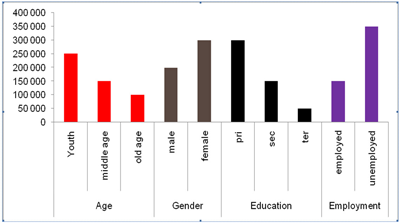
The base population in this settlement type category is 100 000 residents and the growth estimates per annum is 0.86% as calculated above. The following examples provide options of how demographic data in relation to settlement types in a given area can be represented. Please note that not all demographic variables have been depicted, only age, gender, employment and education are used.
Table 1: Demographic information for high income, low density settlement
| Type of settlement | Base population | Growth estimates per annum | Population distribution |
|---|---|---|---|
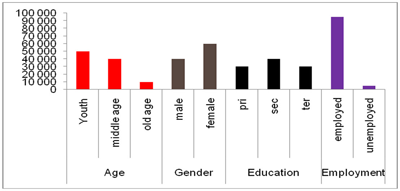
| High income, low density | 100 000 | 0.86% | Age: youth: 50 000, middle age: 40 000, and old age: 10 000 Gender: Male: 40 000, Female: 60 000 Education: Primary: 30 000, Secondary: 40 000, Tertiary: 30 000 Employment: Employed: 95 000 and unemployed: 5 000 |
Graphically the information for this settlement type would be represented as follows:
Graph 1: Demographic information for high income, low density settlement
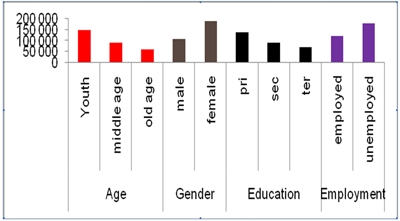
The second example is of a middle income middle density settlement type
Settlement type: Middle income, middle density
Growth estimates per annum for this settlement type would be:
Calculated as Pt = P0 + B - D + I - E ÷ N
200 000=150 000+20 000-10 000+11 000-9 000 ÷ 10
200 000=170 000-10 000+11 000-9000 ÷ 10
200 000=160 000+11 000-9000 ÷ 10
200 000=171 000-9000 ÷ 10
200 000=162 000 ÷ 10
=16.2% in 10 yrs
=16.2 ÷ 10
=1.62% annually
Table 2: Demographic information for middle income, middle density settlement
| Type of settlement | Base population 7 | Growth estimates per annum | Population distribution |
|---|---|---|---|
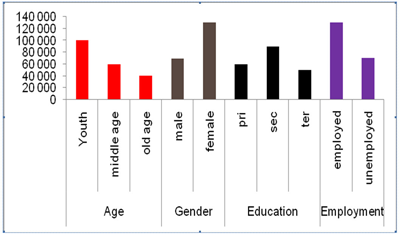
| Middle income, middle density | 200 000 | 1.62% | Age: youth: 100 000, Middle age: 60 000 and Old age: 40 000 Gender: Male: 70 000, Female: 130 000 Education: Primary: 60 000, Secondary: 90 000 and Tertiary: 50 000 Employment: Employed: 130 000 and Unemployed: 70 000 |
Graph 2: Demographic information for middle income, middle density settlement
For low income high density area the population distribution per settlement type would be as follows:
Settlement type: Low income, low density (including informal settlements)
Growth estimates per annum for this settlement type:
Calculated as Pt = P0 + B - D + I - E ÷ N
500 000=350 000+70 000-50 000+20 000-10 000 ÷ 10
500 000=420 000-50 000+20 000-10 000 ÷ 10
500 000=370 000+20 000-10 000 ÷ 10
500 000=390 000-10 000 ÷ 10
500 000=380 000 ÷ 10
=38% in 10 yrs
=38 ÷ 10
=3.8% annually
Table 3: Demographic information for low income, high density (including informal settlements)
| Type of settlement | Base population 7 | Growth estimates per annum | Population distribution |
|---|---|---|---|
| Low income, high density (including Informal settlements) | 500 000 | 3.8% | Age: Youth: 250 000, Middle age: 150 000 and Old age: 100 000 Gender: Male: 200 000, Female: 300 000 Education: Primary: 300 000, Secondary: 150 000 and Tertiary: 50 000 Employment: Employed: 150 000 and Unemployed: 350 000 |
Graph 3: Demographic information for low income, high density settlement
Settlement type: Rural settlement
Growth estimates per annum for this settlement type:
Calculated as Pt = P0 + B - D + I - E ÷ N
300 000=180 000+70 000-20 000+25 000-5 000 ÷ 10
300 000=250 000-20 000+25 000-5 000 ÷ 10
300 000=230 000+25 000-5 000 ÷ 10
300 000=255 000-5 000 ÷ 10
300 000=250 000 ÷ 10
=25% in 10 yrs
=25 ÷ 10
=2.5% annually
Table 4: Demographic information for rural settlement
| Type of settlement | Base population 7 | Growth estimates per annum | Population distribution |
|---|---|---|---|
| Rural settlements | 300 000 | 2.5% | Age: Youth: 150 000, Middle age: 90 000 and Old age: 60 000 Gender: Male: 110 000, Female: 190 000 Education: Primary: 140 000, Secondary: 90 000 and Tertiary: 70 000 Employment: Employed: 120 000 and Unemployed: 180 000 |
Graph 4: Demographic information for rural settlement area
- http://en.wikipedia.org/wiki/Demographics
- High income=R1m + a year; low density
- Middle income=R75 000-R999 000 a year, middle density
- Low income=R0 00-R74 999 000 a year, high density
- Wikipedia pop
- Please note that these are just examples aimed to illustrate how this can be calculated and represented in a table as well as in a graph format. The actual information for your particular municipality can be obtained through Census data, Community surveys or municipal surveys.
- Base population and population distribution is taken from the latest available Census for an example if the last Census was in 2001 whatever the population figures were for a particular municipality in 2001 then that would be the base population for that municipality until the next Census.
2.2.2 Waste quantities and types
A municipality must determine the quantities and the types of waste generated in its area of jurisdiction. This involves establishing the current quantities of waste generated, recycled, treated and disposed of. Waste quantities are usually measured by mass (kilograms or tons). This information is needed for:
- Ensuring adequate planning of resources to deliver waste management services;
- Rolling out of waste collection services to the unserviced area as prioritized by government;
- Establishing waste recycling initiatives i.e. buy-back centres which can have positive impacts in the reduction of the amount of recyclables going to landfill, and the establishment of SMME's in waste management which can promote entrepreneurship amongst residents;
- Provision of a certain number of waste receptacles and the establishment of collection needs i.e. how many skips should be provided in communal areas such as shopping centres, clinics and other public areas such as sport clubs; and for implementing separation at source initiatives,
- Ensuring that the municipality procures the correct types of vehicles as well as budgets for the correct number of vehicles that will be required to effectively deliver the service; and
- Making projections of future waste quantities in order to ensure that provision is made for future waste services delivery and the expansion of infrastructure to deliver the service i.e. the information will highlight if there is a need to establish new waste disposal facilities, transfer stations for faster and more effective collection rates.
This information can be collected from the following sources:
- Waste transporters - Municipalities, Private companies
- Waste managers - waste disposal facilities, treatment facilities
- IDP and municipal records
- Waste Information System: The Department of Environmental Affairs (DEA) and some Provinces (i.e. Gauteng and Western Cape) have developed waste information systems (WIS) which can provide valuable information on waste quantities and types.
(a) Waste information collection methods:
A situation analysis must include waste types and quantities of waste generated in a particular area. This information can be collected using the following methods.
Option1: Weighbridge
A municipality can make use of a weighbridge to collect and record the types and quantities of waste entering its waste disposal facility. This information is also required for reporting on the South African Waste Information System (SAWIS).
Using a weighbridge a municipality must record the amounts of waste entering its waste disposal facility, by weighing the vehicles at the point of entry and again on the way out. The difference in the mass of the vehicle between the 'in' and 'out' provides the mass of the waste. A weighbridge operator is required to correctly identify the types of waste disposed of. The data is captured using weighbridge software programmed with spreadsheet software such as Microsoft Excel or a customized weighbridge software that can simultaneously provide billing information based on the type of waste and the size of the vehicle.
Option 2: Without a weighbridge
Making use of the vehicle capacity and the waste densities template (a volume density estimation system)
In instances where a municipality does not have a weighbridge, it can make use of templates that were developed by DEA which are attached hereto as Annexure A and B. These provide guidance on how waste quantities can be estimated for the different waste streams. Annexure A provides a list of typical vehicles used to dispose of waste in waste disposal facilities. This template makes use of estimations (by mass) that have been made based on the size of the vehicles measured in m3. Annexure B contains possible pre-calculated and estimated density values which are based on the type of vehicle carrying a particular pre-classified waste type.
Waste mass estimation system uses a formula that requires waste volume, waste density and waste loading to determine the mass entering a waste disposal facility.
Example of how to calculate waste quantities using commercial/ industrial waste type/s
Formula: waste mass (kg) =vehicle volume (m3) x load/s x waste density (kg/ m3)
If for an example a vehicle has capacity of 10 m3; and the load is 2, with a waste density of 500 m3 the calculations would be as follows:
10 m3x 2 x 500 (kg/ m3) =10 000kg
The waste mass would then be 10 000kg
The capturing of the daily waste data can be recorded as shown in Table 5.
Table 5: An example of a daily waste data collection template
| Name of Landfill: Municipality X | ||||
|---|---|---|---|---|
| Date: 06/12/2011 | ||||
| Client | Vehicle registration no. | Vehicle capacity in m3 | Type of waste | Load |
| B Kumalo | BN 890 GP | 20 | Garden (greens) | 1 |
| R Naidoo | VW 1232 GP | 30 | Building | 1 |
| Sibanye recycling group | BC 682 GP | 50 | Tyres | 2 |
| V James | RT 782 GP | 10 | Building/garden mix | 1 |
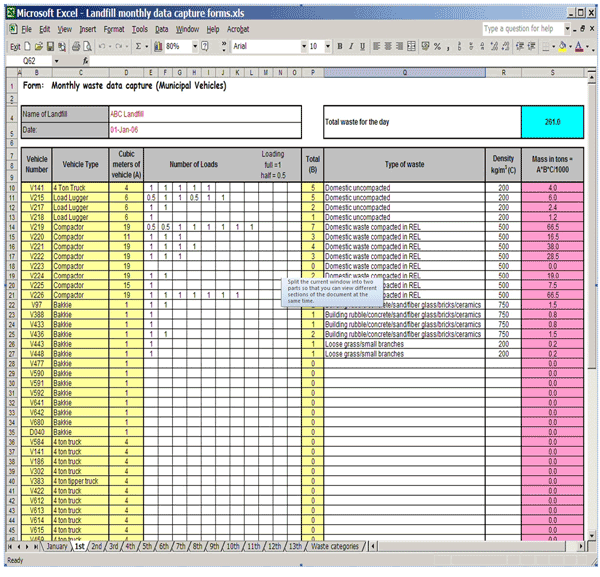
On a monthly basis a municipality must compile a summary of the quantities of waste received and should submit this information to the South Africa Waste Information Centre (SAWIC). DEA has developed data capture forms which comprise of a landfill monthly data capture form as well as a landfill annual data summary form. Using the daily waste data collection form, municipalities are required to enter the information from the daily data capture form into a monthly data form in order to transfer the handwritten data into a spreadsheet. The table below provides an example of how the information is to be captured on a monthly data capture form: NB! This form has already been developed and it is available on SAWIC.
Table 6: An example of a monthly data capture form
Option 3: Sampling or conducting a waste stream analysis at a household/Ward level
Waste stream analysis or a waste audit can be conducted by selecting a representative sample of an area which should at least comprise of 30 %8 of the total sample area. In residential areas, these could be households from different Wards in order to ensure inclusivity and representation. Once that is known, the participating households can then be provided with receptacles and these could be different coloured plastic bags such as a black bag for mixed waste and a clear bag for recyclables. The participating households could also be provided with instructions/ training on the objectives of the study, what is required of them and how the audit will be carried out.
As an example, this could entail explaining to them the different types of commonly found domestic waste streams i.e. Glass, plastic, paper, cardboard, cans and garden waste etc. The participating residents can then be advised to separate their recyclables waste from non-recyclable/mixed waste, if the objective is to also measure the amount of recyclables generated in that area. Once collected, this should be weighed separately in order to gauge the mass of both recyclable waste and non-recyclables. A hand-held scale can be utilised for this purpose wherein the assessors (people employed to carry out the audit) will on the waste collection days or once a week depending on the agreed terms for the study; will individually weigh the waste in order to determine the amount of both recyclables generated in that particular area as well as the weight of non-recyclables.
After obtaining the figures from the participating households/Wards one is then able to extrapolate or estimate the amount of waste that is generated in that particular municipality. This can be done by adding the amounts of recyclables generated in all the areas, and then determine the average recyclables generated as well as by adding up mixed waste to determine their average. The recyclables could even be added up according to the various waste streams i.e. paper, glass, tin, cardboard etc. As illustrated below:
The different waste streams that were predominantly found in this particular area were as follows.
In Ward X, the waste composition and the amount of waste generated for both mixed and recyclable waste was as follows:
Table 7: Summary of waste recording for ward x
| Waste type/streams | Waste generated per week (kg) | Total percentages |
|---|---|---|
| Organic waste | 120 | 44.5% |
| Cans | 60 | 22.2% |
| Paper | 25 | 9.2% |
| Glass | 35 | 12.9% |
| Plastic | 30 | 11.2% |
| Total | 270 | 100% |
An assessor would have to record the types and amounts of waste generated in their study area for a given period of time and would need to write a summary of their findings. In area X the bulk of the waste comprised of organic waste (this included garden waste as well as vegetable peels from the kitchen) which came to 44.5% and from the recycling receptacles, cans were the majority at 22.2% followed by glass at 12.9% and then plastic at 11.2% with paper only making about 9.2% as illustrated above).
The same exercise can be performed for all the households of the different Wards that formed part of the sample size/area and this could even include business areas in order to get a bigger picture of how much waste is generated in that area apart from residential waste.
In order to get a visual description of how much waste is generated in the study area a table or a graph depicting all the different households/Wards that participated in the study could be generated and information from all the surveyed areas could be entered side by side in order to see which of the area/s or Wards in the study area generated the bulk of the waste and what waste streams were the majority.
A waste stream analysis has other benefits such as:
- It will indicate the potential for the establishment of a buy-back centre or the establishment of a Materials recovery facility (MRF).
- Will determine the current waste practices i.e. whether there is recycling taking place or illegal dumping.
Once the waste analysis results are known, they will assist in improving the current state of affairs with regards to waste management i.e. provision of waste management receptacles, establishment of separation at source programmes and recycling initiatives.
(b) Reporting to SAWIS
The Department has developed waste information regulations in terms of section 69(1) (y) and (ee) of the Waste Act that incorporated waste categorisation in order to regulate the collection and reporting of waste data and information to the SAWIS. The following table provides information on the categories/types of waste that should be reported to the SAWIS.
Table 8: General waste types categorisation
| Level 1 | Level 2 - Major Waste Type | Level 3 - Specific Waste Type | ||
| No | Name | No | Name | |
| GW 01 | Municipal waste | 01 | ||
| GW10 | Commercial and industrial waste | 01 | ||
| GW13 | Brine | 01 | ||
| GW14 | Fly ash and dust from miscellaneous filter sources | 01 | ||
| GW15 | Bottom ash | 01 | ||
| GW16 | Slag | 01 | ||
| 02 | Non-ferrous metal slag | |||
| 03 | Other | |||
| GW17 | Mineral waste | 01 | Foundry sand | |
| 02 | Refractory waste | |||
| 03 | Other | |||
| GW18 | Waste of Electric and Electronic Equipment (WEEE) | 01 | Large Household Appliances | |
| 02 | Small Household Appliances | |||
| 03 | Office, information & Communication Equipment | |||
| 04 | Entertainment & Consumer Electronics and toys, leisure, sports & recreational equipment and automatic issuing machines | |||
| 05 | Lighting equipment | |||
| 06 | Electric and Electronic tools | |||
| 07 | Security & health care equipment | |||
| 08 | Mixed WEEE | |||
| GW20 | Organic waste | 01 | Garden waste | |
| 02 | Food waste | |||
| GW21 | Sewage sludge | 01 | Sewage sludge | |
| GW30 | Construction and demolition waste | 01 | ||
| GW50 | Paper | 01 | Newsprint and magazines | |
| 02 | Brown grades | |||
| 03 | White grades | |||
| 04 | Mixed grades | |||
| GW51 | Plastic | 01 | PET | |
| 02 | Others | |||
| GW52 | Glass | 01 | ||
| GW53 | Metals | 01 | Ferrous metal | |
| 02 | Non-ferrous metal | |||
| GW54 | Tyres | 01 | ||
| GW99 | Other | 01 | ||
Once the information on the types and quantities of waste generated in a particular municipality has been collected the municipality can either enter its information directly to SAWIC at www.sawic.org.za or it could manually provide its information to a Provincial waste information officer who will then enter the information on its behalf to SAWIC.
- Taken from StatsSA: general guide for sampling, this implies that in a given area the sample size should at least be 30% of the total population
2.2.3 Determining current domestic waste generation per capita
Estimations on the amount of waste generated can be calculated per week, per month or per year. The 2006 State of the Environment Report (SOER) indicated that South Africa generated 42 million m3 of solid waste per year. This amounted to 0,7kg's per person per day. The generation rates were further broken down into generation rates per income category and the results were as follows:
- Low income= 0.41kg/per person/day or (0.41kgx365 days)=149.65kg/person/year
- Middle income=0.74kg/per person/day or (0.74kgx 365days) = 270.1kg/person/year
- High income= 1.29kg/person/day or (1.29kgx365days) = 470.85kg/person/year
Linking to the table on demographic information under section 2.1.1, and having calculated the current waste generation rates a municipality can then add a column which estimates the current domestic waste generation per capita as illustrated below. In this instance, an assumption is made that the current waste domestic generation rates are according to the 2006, SOER figures and it is classified according to settlement types.
Table 9: Determining current domestic waste generation rates per capita
| Type of settlement | Base population | Growth estimates9 | Population distribution | Current domestic waste generation rates per capita10 (per year in kg's11) |
|---|---|---|---|---|
| High income, low density | 100 000 | 0.86% per annum | Age: youth: 50 000, middle age: 40 000 and old age: 10 00012 Gender: male: 40 000 , female: 60 000 Education: primary: 30 000 , secondary: 40 000 and tertiary: 30 000 |
100 000x470.85 kg = 47 085 000 kg's/person/year Then convert to tons: 47 085 000÷1000 = 47 085 tons |
| Middle income, middle density | 200 000 | 1.62% per annum | Age: youth: 100 000, middle age: 60 000 and old age: 40 000 Gender: male:70 000 , female: 130 000 Education: primary: 60 000, secondary: 90 000 and tertiary: 50 000 |
200 000x 270.1kg = 54 020 000 kg's/person/year Then convert to tons: 54 020 000÷1000 = 54 020 tons |
| Low income, high density (including Informal settlements) | 500 000 | 3.8% per annum | Age: youth: 250 000, middle age: 150 00 and old age: 100 000 Gender: male: 200 000, female: 300 000 Education: primary: 300 000, secondary: 150 000 and tertiary: 50 000 |
500 000x 149.65kg= 74 825 000 kg's person/year Then convert to tons: 74 825 000 ÷ 1000 = 74 825 tons |
| Rural settlements | 300 000 | 2.5% per annum | Age: youth: 150 000, middle age: 90 000 and old age: 60 000 Gender: male: 110 000, female: 190 000 Education: primary: 140 000, secondary: 90 000 and tertiary: 70 000 |
300 000x 149.65kg = 44 895 000 kg's person/year Then convert to tons: 44 895 000 ÷ 1000 = 44 895 tons |
- According to the Mid year growth Estimate report StatsSA 2011
- 2006 State of the Environment Report : low income=0.41kg/person/day
Middle income=0.74kg/person/day
high income=1.29kg/person/day - 1000 kg=1 ton
- Age-Youth=0-35yrs; Middle age=36-60; old age >61
2.2.4 Estimating future waste generation rates and quantities
Future waste trends, in terms of quantities for the planning period should be estimated using the information collected on the domestic waste generation rates per capita for each socio-economic category/types i.e. the population, population distribution, and commercial and industrial waste generation rates.
In this instance, the information is taken as it is from section 2.1.1.under demographics. What has changed is that calculations were made to determine what the future population growth rates would be wherein an assumption has been made that if the growth estimates remained constant for the next 10 years and the per capita waste generation rates also remained constant (as what they were in the 2006 SOER) then results would be as follows:
Table 10: Estimation of future waste generation rates and quantities
| Type of settlement | Base population | Growth estimates13 | Population distribution | Current domestic waste generation rates per capita14 | Future15 domestic waste generation rates per capita (in 10 years) |
|---|---|---|---|---|---|
| High income, low density | 100 000 | 0.86% per annum | Age: youth: 50 000, middle age: 40 000 and old age: 10 00016 Gender: male: 40 000 , female: 60 000 Education: primary: 30 000 , secondary: 40 000 and tertiary: 30 000 |
100 000x470.85 kg = 47 085 000 kg's/ person/year | 108 600 x 470.85kg/person/year = 51 134 310 kg's /person/year Then convert to tons: 51 134 310 ÷ 1000=51134.31 tons |
| Middle income, middle density | 200 000 | 1.62% | Age: youth: 100 000, middle age: 60 000 and old age: 40 000 Gender: male:70 000 , female: 130 000 Education: primary: 60 000, secondary: 90 000 and tertiary: 50 000 |
200 000x 270.1kg = 54 020 000 kg's/person/year | 232400x 270.1kg/person/year= 62771240kg's/person/year Then convert to tons: 62771240 ÷ 1000=62771.24. tons |
| Low income, high density (including Informal settlement) | 500 000 | 3.8% | Age: youth: 250 000, middle age: 150 00 and old age: 100 000 Gender: male: 200 000, female: 300 000 Education: primary: 300 000, secondary: 150 000 and tertiary: 50 000 |
500 000x 149.65kg= 74825 000 kg's person/year | 690 000x149.65kg=103 258 500 kg/person/year Then convert to tons: 103 258 500 ÷ 1000=103258.5 tons |
| Rural settlements | 300 000 | 2.5% | Age: youth: 150 000, middle age: 90 000 and old age: 60 000 Gender: male: 110 000, female: 190 000 Education: primary: 140 000, secondary: 90 000 and tertiary: 70 000 |
300 000x 149.65kg=44895 000 kg's person/year | 375 000x149.65kg= 561 187 50 kg's/person/year Then convert to tons: 561 187 50 ÷ 1000=56118.75 tons |
- Assuming that the population growth rates will remain constant for the next 10 years
- Assuming that the per capita waste generation rates would be according to the 2006 State of the Environment Report for all income categories:
low income=0.41kg/person/day Middle income=0.74kg/person/day,
high income=1.29kg/person/day - 10 years time assuming that the waste generation rates would be according to the 2006 State of Environment figures.
- Age-Youth=0-35yrs; Middle age=36-60; old age >61
2.2.5 Waste recycling, treatment and disposal
(a) Waste recycling
This section entails the identification of existing recycling initiatives and it must be indicated whether these are recycling initiatives by the municipality or industry lead. This can be for the various waste streams such as paper, glass, plastic, metal or even composting and these could even be community run initiatives through private individuals, co-operatives/recycling groups including NGO's. The available recycling infrastructure such as buy-back centres, Materials Recovery facilities should be identified in order for the municipality to publicise these through education and advocacy to ensure maximum participation by the residents.
Established recycling facilities should be described for each local authority, as follows:
- Existing recycling facilities (name of the facility, location, the capacity i.e. can process so many tonnes of waste per month, treatment, age, etc.);
- Commodities recycled (e.g. waste paper, cans, plastic and glass); and
- Quantities of waste recovered
(b) Treatment and Disposal
Municipalities should keep a record of waste disposal facilities under their area of jurisdiction and should indicate the status of these waste disposal facilities (i.e. whether they are licensed or unlicensed) including treatment facilities for hazardous waste (even if they are owned and operated by the private sector). Municipalities are required to ensure that waste is properly managed and disposed of according to Waste license conditions. It is also important that municipalities must establish the size of their waste disposal facilities; the anticipated lifespan and/ or available airspace, types and quantities of waste disposed, and should take note of whether these are operated in a sound and environmentally acceptable manner.
(i) Determining available airspace at waste disposal facilities
Determining the available waste disposal facilities' airspace assists in understanding the amount of waste that can still be accepted as well as in knowing the remaining airspace. Importantly, it will assist a municipality to plan for the future i.e. if the waste disposal is almost near its end of life then a municipality could be proactive by lodging the necessary applications to obtain a license for a new waste disposal facility, and or secure funding for upgrading the existing waste disposal facility/ies or securing funding to construct new ones.In order to determine the available waste disposal facility's airspace, various methods can be employed. Topographical method is one of them. Using the topographical method in determining the remaining capacity of a waste disposal facility; a municipality needs to know the current and final capacity of the currently licensed waste disposal facility. According to this method, the current and final capacity of the waste disposal facility is used to determine the current and final volumes. The remaining capacity is calculated using the final capacity/volumes minus the existing capacity/volumes, for example:
Final capacity-Existing capacity= Remaining Capacity
If a waste disposal facility has a final capacity of 500 000m3 and the existing capacity is 300 000m3 then the remaining capacity would be 200 000 m3 calculated as follows:
500 000m3-300 000m3=200 000m3
In instances where there is no information available to determine airspace/capacity in a given municipality; it can be obtained from the following sources:
Box 2: Sources of information for determining the available waste disposal facilities capacity
Sources of waste disposal facilities capacity information:
|
The following table provides an example of how this information can be recorded in instances where there are more than one waste disposal facilities in a given municipality.
Table 11: Status quo of waste disposal facilities in a particular municipality
| Name/s of Disposal site/s | Status | Total capacity | Available waste disposal facility/ies airspace |
|---|---|---|---|
| Vondeling waste disposal site | Licensed | 2,500 000 m3 | 1,500 000 m3 |
| Giyani Waste disposal facility | Unlicensed | 2,000 000 m3 | 1, 350 000 m3 |
2.2.6 Status of waste collection services
(Number of persons not receiving a waste collection service)
A list containing areas that receive a waste collection service and areas that do not receive waste services should be developed. For indigent households, municipalities are required to register indigent households on an indigent register and should ensure that it is kept up to date. The National Domestic Waste Collection Standards can be used as a guideline on the acceptable collection standards for the different settlement types. Further a municipality needs to develop a plan on how it will roll out waste collection services in the different settlement types. For example, different methods could be employed to deliver the service such as making use of the community based collection model in areas that are densely populated using local labour and so forth. A municipality also needs to develop an inventory of its own resources being it financial, infrastructure and human resources in order to highlight how it will deal with providing the service to indigent households and if new establishments are constructed, how it will deal and cope with such expansion.
Table 12: Status of waste collection services per settlement type
| Settlement type | Total households | Total no. of serviced households | Total no. of unserviced households | Total indigent households (taken from total households) | Total unserviced indigents households (taken from total unserviced households) |
|---|---|---|---|---|---|
| High income, low density | 1000 | 1000 | 0 | 0 | 0 |
| Middle income, middle density | 100 000 | 60 000 | 40 000 | 10 000 | 5000 |
| Low income, high density (including Informal settlement) | 200 000 | 100 000 | 100 000 | 40 000 | 40 000 |
| Rural settlements | 300 000 | 50 000 | 250 000 | 170 000 | 170 000 |
The delivery of waste collection services to indigent households as well as rolling out services to previously un-serviced areas could be listed as one of the strategic goals of a municipality. Attaining this target could be achieved through listing the goals and targets in the implementation plan to ensure that it will be prioritised.
(i) Collection needs
It is crucial to establish the extent of collection services provided by the municipality as well as the collection routes in a geographical area or in municipal demarcated collection regions. This can be achieved through mapping the collection routes/areas in order to ascertain the proximity of waste collection routes to the waste disposal sites in order to ensure efficiency and fast turnaround times.
Box 3: Mapping the geographic waste management area
|
Tip on mapping the geographic waste management area A map depicting collection and transportation routes, recycling depots and the location of the disposal facilities or sites should be developed. This information will indicate where there is a need to establish transfer stations and in order to optimise the sites for recycling, and disposal facilities. This map could be a conventional drawing or can be generated by geographic information system (GIS) software and/or generated using a recent Google earth map. If a municipality does not have the GIS system or internet connectivity to download a Google map, it should consult its Town and regional planning division as this unit keeps copies of municipal maps. |
Box 4: Information on the status of waste collection services
Sources of information for waste collection data:
|
By establishing collection routes, a municipality would be able to properly plan for collection and disposal of waste to and from households to the waste disposal facility/ies, at the same time this information could also be used to gauge whether there is a need to develop transfer stations especially where there are vast travel differences between the collection points and the disposal points in order to save on time and financial resources.
2.2.7 Financing of waste management
(a) Budgeting for waste services
The Municipal Systems Act, Act no. 32 of 2000 (Chapter 8, ss73-86A) requires that municipalities must ensure proper budgeting in order that they are able to deliver on their Constitutional mandate with regards to the provision of waste services. In order for a municipality to successfully implement its IWMP, it is important to establish the current available resources in terms of finance; human resources, technical skills to deliver on the municipality's mandate and to implement the goals and targets contained in the plan i.e. development of by-laws and lastly, funding for operational and maintenance costs for equipment for the effective delivery of waste services and establishment of waste disposal facilities. Further, financial management/budgeting is key as it will assist in identifying future resource needs i.e. if there is an increase in the number of households requiring waste collection services what additional resources will be required to deliver the service. A typical budget includes the following information:
Table13: Examples of categories of waste management cost drivers
| Item | Amount per annum | |
|---|---|---|
| Collection | Transportation | R700 000 |
| Capex-purchase (vehicles) | R400 000 | |
| Maintenance | R100 000 | |
| Fuel | R150 000 | |
| Receptacles | R50 000 | |
| General | R25 000 | |
| Recyclables | R25 000 | |
| Governance | Staff (remuneration) | R1 000 000 |
| Education and awareness | R500 000 | |
| IWMPS | R500 000 | |
| Disposal | By-laws | R500 000 |
| Transfer station | R300 000 | |
| Disposal sites | R10 000 000 | |
| Acquisition of land, equipment | R5 000 000 | |
| Regulatory compliance, EIA's and licence | R5 000 000 |
Table 14: Summary of the budget
| Item | Total amount |
|---|---|
| Collection | R700 000 |
| Governance | R2 500 000 |
| Disposal | R10 300 000 |
The available income/revenue should be listed and the sources of income must also be indicated. Of importance is that a municipality should determine how much revenue is generated in a given year and it should keep record of income and expenditure for compliance reasons (MFMA).
(b) Organisational and institutional matters
Under this section, a municipality must indicate its current organizational structure or organogram in order to determine the available human resources to deliver waste services. The organogram will highlight the number of available staff under each section such as staff to perform management duties, planning, waste collection, recycling and disposal, and enforcement etc. Further an organizational structure could potentially be used to evaluate gaps in areas where there are new functions that must be performed in order to fulfill the Waste Act's requirements. An example of an organogram is illustrated below:
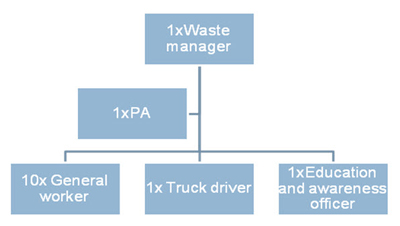
Figure 3: Current organogram
If the above was an organogram of a particular municipality, then that municipality would require additional capacity in order to be able to meet the Waste Act's requirements which amongst others include the development of by-laws, enforcement of by-laws (designation of EMI's), a waste disposal facility manager to manage its waste disposal facility according to the Waste license and supervisors to supervise general workers. Staff shortages can be addressed as one of the goals/targets under the implementation plan as the successful implementation of an IWMP lies in the availability of staff to deliver on the municipality's mandate.
2.3 Desired end state
2.3.1 Setting strategic goals, targets and indicators
The desired end state entails identifying priorities and goals that a municipality wishes to attain with regards to waste management. Using the information collected on the historical and present waste management situation, strategic goals for the IWMP should be developed. These should aim to address the gaps and the needs of the community and more importantly should respond to the Waste Act requirements. A program on how these will be attained is developed as an implementation plan. The strategic goals must be set based on the relevant waste legislation, regulations and policies and should be guided by the waste management hierarchy principles. Further, it should also include the setting of targets for waste management services such as collection, recycling, recovery and disposal. The setting of goals, objectives and targets must also take into consideration the municipal response to the goals and targets set in the National Waste Management Strategy.
The National Waste Management Strategy provides a set of goals that municipalities must achieve in the next five years in order to give effect to the Waste Act. It contains an action plan with various targets to be achieved by municipalities in the next five years until 2016. It is important that there should be a target date by which municipal strategic goals and targets are to be attained within the 5 years from the date the IWMP has been approved.
Strategic goals can be divided into:
- Immediate: 1 year
- Short-term: 2 to 3 years
- Medium term: 3 to 5 years and
- Long-term: 5 to 10 years
Long term goals relate to targets that extend beyond the 5 year period of implementing an IWMP i.e. decommissioning and planning to develop a new waste disposal facility.
The following tables provide examples of how a desired end state for waste management strategic goals can be captured:
For example, in this particular municipality goal 1 was to promote recycling and the recovery of waste; in a tabular format this would be represented as follows:
Goal 1: Promote recycling and recovery of waste
| Immediate goals | Short term goals | Medium term goals | Long term goals |
|---|---|---|---|
| Establish mechanisms for promoting separation at source | Roll out separation at source to 30 % of households | Roll out separation at source to 70 % of households | 100% households receiving separation at source |
| Conduct a feasibility study to determine whether there is a need to establish buy back centres | Develop plans to establish buy back centres | Buy back centres established | |
| Develop a composting strategy to divert garden waste to landfill | Establish a compost recycling plant | Compost recycling plant fully operational and is operated in a sustainable manner |
Goal 2: Ensure the effective and efficient delivery of waste services
| Immediate goals | Short term goals | Medium term goals | Long term goals |
|---|---|---|---|
| Develop a strategy for the collection of waste services | Increase the roll out of waste collection services by 50% of households (including indigents) | Increase the roll out of waste collection services by 70% of households (including indigents) | Increase the roll out of waste collection services by 100% of households (including indigents) |
Goal 3: Ensure that legislative tools are developed to deliver on the Waste Act and other applicable legislation
| Immediate goals | Short term goals | Medium term goals | Long term goals |
|---|---|---|---|
| Develop/ amend waste by-law | Review by-laws |
Goal 4: Sound budgeting and financing of waste management services
| Immediate goals | Short term goals | Medium term goals | Long term goals |
|---|---|---|---|
| Conduct full cost accounting for waste services | Set and implement tariffs for waste collection and disposal | Review and implement tariffs for waste collection and disposal | Review and implement tariffs for waste collection and disposal |
| Allocate budget for waste services from equitable share funding | Allocate budget for waste services from equitable share funding | Allocate budget for waste services from equitable share funding | Allocate budget for waste services from equitable share funding |
Goal 5: Ensure the safe and proper disposal of waste
| Immediate goals | Short term goals | Medium term goals | Long term goals |
|---|---|---|---|
| Apply for a waste license in order to have an approved waste disposal facility | Train waste disposal facility managers/operators in order that the disposal facility/ies can be run in accordance with the license requirements | Train waste disposal facility managers/operators in order that the disposal facility can be run in accordance with the license requirement | Train waste disposal facility managers/operators in order that the disposal facility can be run in accordance with the license conditions |
| Determine the available waste disposal airspace and apply for a waste license to construct a new waste disposal facility | Secure funding for the construction of a new waste disposal facility Construction of waste disposal facility |
Secure funding for the construction of a new waste disposal facility Construction of waste disposal facility |
Secure funding for the construction of a new waste disposal facility Construction of waste disposal facility |
Goal 6: Education and awareness
| Immediate goals | Short term goals | Medium term goals | Long term goals |
|---|---|---|---|
| Recruit environmental/waste education personnel | Develop an education and awareness strategy and training materials to roll out education and awareness campaigns | Education and awareness campaigns implemented in a sustainable manner | |
| Develop a schools competition programme to encourage school’s involvement on waste management issues i.e. recycling | Roll out the competition and work closely with the schools to ensure maximum participation |
Goal 7: Compliance and enforcement
| Immediate goals | Short term goals | Medium term goals | Long term goals |
|---|---|---|---|
| Determine the required number of EMI's for the municipality to enforce by-laws and other waste transgressions. | Appoint staff to enforce by-laws Enforce by-laws |
Enforce by-laws | Enforce by-laws |
| Develop a system for residents to report waste transgressions |
2.4 Identify, evaluate and select alternatives
2.4.1 Identify and evaluate alternatives
Under this section a municipality must undertake to identify the different alternatives that can be employed to achieve the desired end state and it should indicate the different approaches to achieve the targets. It is crucial to explore different approaches that can be employed for all aspects to waste management. A municipality must indicate the best possible way of attaining the goals by weighing the costs vs the benefits of each.
A municipality is required to critically look at all the requirements and should decide based on its available capacity and financial resources, which of the requirements will be attained in the short-medium to long term and what the implications would be if no action is taken. During the consultation phase of the development of an IWMP, it is important to make stakeholders aware of the requirements in terms of the Waste Act, in order that if there are tradeoffs to be made, they too can be involved in prioritising the services to be delivered.
As an example:
In municipality X, the following was identified as a goal:
Goal 1: Promote recycling and the recovery of waste
Target: (separation at source and recycling)
In order to attain this goal the municipality will need to put in place the following measures:
Legal requirements/framework
Develop and/or observe the legal framework governing waste separation at source i.e. National domestic waste collection standards. Develop a system to roll out separation at source in terms of the standards wherein receptacles will be provided for recyclables and non-recyclables to be collected from households.
The municipality should lay out the standards that must be adhered to i.e. how many and what types of receptacles will the municipality deliver per household? Will these be two plastic bags one clear for recyclables and another one black for all other waste? Where will the recyclables be taken for recycling? How many times will the receptacles be collected?
The municipality should consider where the receptacles will be placed in areas where door-to-door collection is not feasible.
Resources/Finances:
How will the municipality finance separation at source programmes? The programme could be financed through the sale of receptacles or it could be financed through a joint venture with industry where the municipality could ensure that a contractor has access to the recyclables and in turn the service provider will fund the transport costs as well as will employ locals in the collection and recycling of the material. What is important is that the municipality must ensure that the service is delivered in a sustainable manner.
The sub-contractor/s could also be advised to collect recyclables separately in order to generate more income from the sale of the recyclables.
Or if the service will be delivered in-house a municipality must indicate that it will use that method.
Human resources:
A municipality could look at its current organogram in order to determine whether sub-contracting the service would be more effective as opposed to sub-contracting the service. If it is going to be delivered in-house, does the current organogram have sufficient human resources to deliver the service? If not how many additional staff members should the municipal have and at what cost?
Goal 2: Ensure the effective and efficient delivery of waste services
Target: Roll out waste collection to un-service areas (including indigent households)
In order to achieve this goal a municipality would need to undertake the same exercise as in goal 1 where it should consider the following:
Legal requirements/framework:
What are the applicable policies for waste collection and how do those suggest the service should be delivered to residents? i.e. National policy for the provision of basic refuse removal services to indigent households. Are there any municipal by-laws regulating the delivery of waste management services and if so what methods are recommended for the collection of waste in the different settlement types?
Resources/Finances:
Options on how to provide the service in a cost effective manner must be considered. These could involve making use of locals to service densely populated settlements such as informal settlements.
Increase SME participation by encouraging locals to explore opportunities in waste through using labour intensive collection models.
The main aim is to increase the number of households receiving a waste collection service and by promoting labour intensive collection methods a municipality could realize other spin offs such as creating job opportunities as well as encouraging entrepreneurship.
Transportation:
How many vehicles will be required to deliver the service and how many personnel should be employed to carry out the delivery of the service? What types of vehicles can be utilized to deliver the service in the different settlement types i.e. will compactor trucks work in informal settlements or are these areas better serviced by a local contractor using a normal bakkie?
Further, a municipality could explore mapping out waste collection routes and this could lead to fast turnaround times and therefore the service could be delivered in the most economical manner.
The cost-benefit analysis will indicate the best possible options i.e. whether the service should be provided in-house or certain aspects to waste management should be sub-contracted. The chosen options must be indicated in the implementation plan.
The evaluation of alternatives should be performed for all the goals as listed in the desired end state.
Lastly, a municipality should also indicate the implications should there be lack of action on the strategic goals
Goal 1: Promote recycling and the recovery of waste (separation at source and recycling)
- If no action is taken to achieve this goal the municipality will be in contravention of the Waste Act which requires municipalities to promote the waste management hierarchy approach to waste management where as much waste as possible should be recycled.
- The National domestic waste collection standards which calls for municipalities to provide receptacles in order to divert recyclable waste to landfill.
- Waste that could otherwise be recycled will be disposed of in a waste disposal site; the resulting impact would be; failure to contribute to government's target on diverting recyclables to landfill.
- Will experience environmental impacts associated with land filling such as the contamination of underground water resources, poorly run waste disposal facilities posing health and safety challenges to workers and reclaimers.
- The municipality will miss out on an opportunity to create employment and contribute towards local economic development if no recycling is promoted
Goal 2: Ensure the effective and efficient delivery of waste services
- The municipality will be in contravention of the National policy for the provision of basic refuse removal services to indigent households which requires that waste collection services should be delivered to indigent households.
- Will not contribute to government targets (Outcome 10 targets) which aim to increase the number of households receiving a waste collection service from 64% to 75% by 2015.
- Further, it will contravene any applicable municipal by-laws including the municipality's Constitutional obligation on the delivery of waste collection services
- The poor and the most vulnerable will continue to live in unhygienic conditions posing health and safety challenges such as vector borne diseases
This exercise should be performed for all the chosen goals in order for the municipality to have a thorough understanding of what is required, how to achieve the goals and what the implications could be if there is no action.
2.4.2 Select preferred alternatives
After the identification and evaluation of possible alternatives with regard to their implications be it negative or positive in terms of socio-ecological and economical impacts, under this section a municipality is required to indicate its chosen alternatives for each waste management goal. Each goal may require specific resources i.e. x amount of money, x number of additional personnel etc.
For Goal 1: Promote recycling and the recovery of waste: the following will be required:
What method/methods will be employed to achieve this goal? What does the Waste Act say i.e. the waste management hierarchy approach? What does the Outcome 10 target say? What local resources could be employed to achieve this goal? For an example:
In the evaluation of preferred alternatives the best option was to deliver the service through a Public-Private partnership. This will entail the following:
- Industries will in conjunction with the municipality establish a Public-Private partnership that will drive separation at source as well as recycling initiatives in order to meet the target to divert recyclables from going to waste disposal facilities, as well as promote other options of the waste management hierarchy
- The municipality's role would be to educate it's households on the benefits of separation at source i.e. amongst other things it has economical benefits because the waste will not be contaminated, it will be diverted from landfill thereby will prolong the municipality's waste disposal site lifespan, residents will enjoy social benefits, jobs will be created in the recycling value chain etc.
What methods could be employed to drive recycling?
A Public Private Partnership between the municipality and a private company could be established to drive recycling in the community. The municipality's role could be that of providing receptacles as required by the standards whereas the private recycling company would be responsible for removing the recyclables from households thereby will be responsible for transport costs.
In densely populated settlements such as informal settlements: The municipality could deliver the service using the following method:
Communal collection points whereby community members could make use of wheelbarrows to collect the recyclables from the individual households into designated communal collection points. Once or twice a week, these would be collected by the recycling company to an MRF or buy-back centre. In this process, the municipality should as much as possible try to involve local sub-contractors that will use their own vehicles in order to promote SMME development and entrepreneurship. This could be a cheap and a cost effective way of removing the recyclables from the households whilst at the same time it will create employment and promote SMME development.
The sub-contractors could also be advised to collect recyclables separately in order to generate more income from the sale of the recyclables.
For Goal 2: Ensure the effective and efficient delivery of waste services
The chosen alternatives were as follows:
Waste collection services in the municipality will be delivered by the municipality itself. This will require an additional of 40 general workers. However, the municipality will sub-contract the service for densely populated areas such as informal settlements at a cost of R5 million. The municipality will employ an additional waste manager to manage the contract in order that the service can be delivered effectively.
3. Communication and stakeholder participation
Under the Waste Act, Chapter 3, section 11 (7b) states that. “A municipality must, before finalising its integrated waste management plan, follow a consultative process contemplated in section 29 of the Municipal System Act, either as a separate process or as part of the consultative process relating to its IDP contemplated in that section’’.
Apart from the Waste Act calling for community/stakeholder participation, Chapter 4 of the Municipal systems Act encourages municipalities to conduct community participation when developing their IWMP and it provides different mechanisms by which this could be done.
The following box provides ideas on the different stakeholders that municipalities could consult:
Box 5: Identifying interested and affected parties
Tip: Identifying interested and affected parties are: These could be:
|
3.1 Consultation process: Stakeholder participation
It is important to identify and consult stakeholders throughout the development of the plan. This section should summarise the stakeholders that have been consulted; their issues, concerns, views and inputs. Further municipalities should provide responses to the concerns and issues raised by stakeholders during consultation process where possible. A data sheet detailing all the stakeholders, and their inputs should be kept. Below is an example of how this can be captured:
Table 15: Stakeholder consultation and participation
| Organisation | Issues raised/ Concerns | Municipality's response | General comments |
|---|---|---|---|
| NGO | Role of waste pickers in recycling | The municipality will include waste pickers in waste recycling initiatives | Comment noted, the concern will be dealt with under recycling |
| Business | When will discharge fees be implemented and what criteria will be used to charge disposal fees? | Tariff codes will be set up for different waste types entering the landfill | The full cost accounting study has provided for a range of economic instruments, one of which is the implementation of tariff codes at waste disposal facilities, Interested and affected parties will be informed of the commencement date. |
| General members of the public | Litter is a serious problem in our area, what is the municipality doing to deal with this issue; as it creates a nuisance and has caused vector borne diseases? | A number of interventions are going to be employed, amongst others; will be awareness campaigns on littering and community involvement, the deployment of EMI's to ensure that municipal by-laws are enforced and the inclusion of waste education in the environmental curriculum to educate learners about the environmental and social consequences of littering. | Littering and the enforcement of municipal by-laws have been included as part of our strategic goals and the municipality has developed an implementation plan to ensure that these issues are addressed. |
3.2 Awareness campaigns and communication
The Waste Act requires the development of an IWMP to follow a public participation and consultation process (Section 72 and Section 73). Awareness programs should be developed in order to keep stakeholders abreast on issues pertaining to the development and implementation of the IWMP. A municipality can engage its stakeholders in various platforms such as:
- Ward Committee meetings.
- Waste management forum meetings,
- Workshops with interested and affected parties (could include youth environmental groups, taxi associations, religious groups, businesses operating in the area, schools etc.)
- Awareness campaigns i.e.as part of the development of an IWMP a municipality could publish information about the IWMP process and could communicate this in local media such as newspapers, local radio stations, print the information and post it on community notice boards.
The issues raised during the stakeholder participation process should be captured and dealt with under the implementation plan and stakeholders should be informed of progress made with regards to attaining the goals in the five years of implementing the IWMP.
Once the IWMP has been approved it is advisable that stakeholders should be kept informed on the implementation of the plan. Where possible, the annual performance reports that are required by the Waste Act should be made available to them or discussed during community meetings in order that stakeholders can track progress with regards to the municipality's ability to meet the targets contained in the plan.
4. Implementation instruments
The partnerships, legislative instruments, economic instruments and a financial plan appropriate for the IWMP will be established in consultation with the stakeholders.
4.1 Partnerships
The development of partnerships as a mechanism for providing the services and facilities required for Integrated Waste Management should be considered. The categories of partnerships that should be considered include:
- Public-public partnerships: this can be a partnership (between a District municipality and local municipalities) for collaborating on waste services such as on the establishment of a regional waste disposal facility or in instances where local municipalities have limited capacity to provide the delivery of waste services,
- Public-private partnerships (PPP): for collaborating on financial assistance for waste services, establishment of waste management facilities, establishment of separation at source and other waste management initiatives i.e. development and management of waste disposal facilities, establishment and management of MRFs, transfer stations, and recycling facilities.
- NGO/Community based organisations (CBO's): partnership with the municipality in order that they may participate or carryout awareness and education campaigns and programs.
The following provides a snapshot of how these partnerships could work, as well as indicates the various aspects that a municipality could partner on with the identified stakeholders.
- Public-private-partnerships: could be formed by calling for proposals from interested parties to indicate how they are going to deliver a certain aspect to waste management. Once the tender has been concluded and the municipality should sign a memorandum of understanding (MOU) in order that the conditions contained in the MOU should be met. The municipality could decide to play an oversight role while the service provider will be responsible for the delivery of the service. Some of the services could include carrying out recycling initiatives through Co-operatives (Co-ops), private company or through a community based waste collection method etc.
- Leases: in this type of a partnership a municipality would lease land to Co-ops or a private company to establish a buyback centre in order to carry out recycling;
- Privatisation: of a waste collection service i.e. the transportation aspect to the service / transfer of ownership whereby a driver-owner scheme could be in place, this entails the owner of a truck being the actual driver that provides the service on behalf of the municipality;
- Joint ventures: in a wide variety of areas such as in operating a waste disposal site, or in the construction of a waste disposal facility where a private company would be responsible for the project or certain aspects thereof.
Partnerships in the delivery of waste management services should be encouraged and municipalities should ensure that there are binding agreements in place to ensure that the services will be delivered. The formation of PPP's for the implementation of IWM plans should be investigated. PPP's for smaller local authorities could greatly reduce the cost of equipment and salaries and should be encouraged. Partnerships in waste collection can prove very beneficial for small local authorities and should be considered for public-public as well as for public-private partnerships.
4.2 Legislative instruments: Development and enforcement of by-laws
Local government may develop by-laws, which augment National and Provincial regulatory requirements. These by-laws must aim to give effect to the right contained in section 24 of the Constitution by regulating waste management within the area of the municipality's jurisdiction; provide, in conjunction with any other applicable law, an effective legal and administrative framework, within which the Municipality can manage and regulate waste management activities; ensure that waste is avoided, or where it cannot be altogether avoided, minimised, re-used, recycled, recovered, and disposed of in an environmental sound manner; and promote and ensure an effective delivery of waste services. The by-laws must also be aimed at discouraging littering by prosecuting offenders amongst others.
Local government may also enforce these by-laws either through local or regional authorities through designated EMI's. To increase capacity to enforce municipal by-laws; municipalities can explore training Metro police/ local enforcement agencies on waste related matters in order that they too are equipped and are able to issue fines on waste management transgressions. Environmental Health Practitioners (EHP's) could also be trained on waste matters in order that they can administer the enforcement of waste by-laws.
4.3 Funding mechanisms
Appropriate economic instruments should be evaluated and implemented.
A critical precondition for the successful implementation of IWMPs is access to sufficient funding to carry out the plan. Funding will be required for inter-alia: building capacity within the municipality; the development and implementation of by-laws; development and implementation of IWMP; development, operation and maintenance costs of waste management facilities; and the design and commissioning of new waste management facilities.
Different sources that a municipality could potentially obtain funding from could include Equitable Share Funding, grant allocation, revenue from rates and tariffs, revenue from fines. For once off projects, funding sources could include the Municipal Infrastructure Grant (MIG) funding for infrastructure related projects, donor funding to fund certain aspects to the delivery of waste services.
It must be noted that not all funding sources are sustainable, for example donor funding is sometimes only available for a limited period.
In order for municipalities to have sustainable sources of revenue, a full cost accounting of how much it realistically costs them to deliver waste management services should be developed. Once developed, municipalities will then be able to charge tariffs that are reflective of the cost of rendering waste management services and will generate accurate revenue for the waste services rendered. Municipalities will also be able to determine whether there is under-recovery of waste collection revenue from its customers or not.
Below are some examples of economic instruments that could be considered for funding the various aspects to waste management.
- Funding mechanisms for recycling
Recycling initiatives could be funded through public-private initiatives whereby the municipality could provide receptacles for separation at source by households and a recycling company could, at their cost, collect the recyclables.
Another scenario could be that of Community based recyclers; wherein they could organize themselves and with the help of a municipality participate in recycling where they could be the ones employed in carrying the further sorting of recyclables in an buy back centre which could then be sold to recycling companies as a way of generating income to sustain the program.
Further, the following funding models could be employed in order to ensure the financial sustainability of waste management initiatives:
- Fiscal funding allocation
- User charges e.g. volumetric charging
- Revenue collection from penalties, fines or levies
- Establish partnerships with industry wherein the industry may finance aspects of recycling i.e. fund the transport costs to carry out recycling (the NWMS has identified the Packaging industry as one of the industries that must develop an Industry Waste management plan which should stipulate how it will deal with packaging waste in order that it should not land up on waste disposal facilities)
- Funding mechanisms for waste collection and transportation
To facilitate the funding of waste collection and transportation, possible sources of funding for waste collection and transportation could include:
- Payment for services rendered (full cost accounting will ensure that appropriate fees are charged) in order that waste management services are delivered sustainably, cross-subsidisation could be explored whereby poor communities could be subsidised by paying households in order that basic services are rendered to indigent households;
- Local government budgetary allocations (from Equitable share funding allocation); and
- Use of public-private partnerships.
- Funding mechanisms for waste disposal
The cost associated with general waste disposal will mainly be funded by user fees or as part of waste charges for local authority's general waste disposal sites. The introduction of waste disposal tariffs at all waste disposal facilities, reflecting the real cost of waste disposal, should be encouraged.
Public-private partnerships may be established for the development and operation of waste facilities including regional waste disposal facilities. In this type of partnership a memorandum of understanding/agreement could be signed between a municipality and a private company wherein it will be agreed on whether the private company will make an upfront payment towards the establishment of the waste disposal facility and once in operation the private company will utilize the disposal facility and in turn instead of being charged disposal fees the municipality would deduct from the amounts already paid in advance.
Mbombela Local Municipality is one such an example whereby this Municipality entered into a joint venture with a private company for the establishment of its waste disposal facility and the private company made an upfront payment to this municipality and every time the company uses the waste disposal facility deductions are made from the upfront payment that was used to establish the site until such a time that there amount has been used up.
4.4 Implementation plan (summary of an IWMP)
A municipality must develop an implementation plan which details how the targets set in the goals will be attained as well as what resources will be required to attain the targets in the next five years. In this instance, the implementation plan has been developed in a manner that summarises the entire IWMP planning process in order to demonstrate how each of the steps fit into each other. For example:
Table 16: Implementation plan (summary of an IWMP planning process)
| Situation analysis (current situation/ challenges identified during the situation analysis compilation process) | Desired end state (Goals) | Targets | Y1 | Y2 | Y3 | Y4 | Y5 | Selected alternatives | (Implementation mechanisms) Resources | ||
|---|---|---|---|---|---|---|---|---|---|---|---|
| Human resource (HR) | Equipment (EQP) | Finance (HR+EQP) | |||||||||
| All waste going to waste disposal facilities | Goal 1: Promote recycling and recovery of waste | Establish mechanisms for promoting separation at source | X | Establish a pilot project for separation at source | 2 additional personnel (remuneration) | Waste receptacles | R500 000 | ||||
| Roll out separation at source to 70% of households | X | Roll out separation at source through a public private partnership (PPP) | 2 additional personnel (remuneration) | Waste receptacles, 2 collection and transportation vehicles |
R2 000 000 | ||||||
| 100% households are participating in separation at source | X | 2 additional personnel (remuneration) | Waste receptacles, 1 collection and transportation vehicle |
R3 500 000 | |||||||
| Develop a composting strategy to divert garden waste from waste disposal facilities | X | Develop a composting strategy | 1 project manager from the municipality to oversee the feasibility study and the strategy development process | R200 000 | |||||||
| Establish a compost plant | X | Establish a compost plant to divert garden waste, to be operated by a service provider | 1 project manager from the municipality to manage the contractor | Procure equipment needed to run a fully compliant compost plant such as forklifts, grinding buckets, wood chippers, etc.) | R3 000 000 | ||||||
| Some of the households are not receiving waste management services | Goal 2: Ensure the effective and efficient delivery of waste services | Develop a strategy for the collection of waste services | X | Labour intensive collection model/ approach | 1 additional personnel (project manager) (remuneration) | R500 000 | |||||
| Increase the roll out of waste collection services to 30% of households (including indigents) | X | Labour intensive collection model/ approach | 2 additional personnel to manage the contractors | Establish a transfer station/ MRF facility, procure waste receptacles/bins | R3 000 000 | ||||||
| Increase the roll out of waste collection services to 70% of households (including indigents) | X | Labour intensive collection model/ approach | Additional personnel to manage the contractors | Procure waste receptacles/bins | R3 000 000 | ||||||
| There is no waste management by-law in place | Goal 3: Develop legislative tools to enforce the Waste Act and other applicable legislation | Develop a strategy for the collection of waste services | X | Develop a waste management by-law | Personnel (project manager and waste officials) | Computer and stationery | R200 000 | ||||
| Review waste management by-law | X | Review by-law/s | Personnel (project manager and waste officials) | Computer and stationery | R250 000 | ||||||
| The budget is not ring fenced and there are no proper mechanism for cost recovery for the services rendered | Goal 4: Sound budgeting and financing of waste management services | Conduct full cost accounting for waste services | X | Conduct a full cost accounting exercise internally and ensure the proper budgeting of waste service and services rendered | Personnel (remuneration) | Computer and stationery | R80 000 | ||||
| Set and implement tariffs for waste collection and disposal | X | Implement tariffs for waste collection and disposal Procure a service provider to develop the tariff model |
Personnel (will be implemented by existing staff) | Computer and stationery | R200 000 | ||||||
| Review and implement revised tariffs for waste collection and disposal | X | Personnel (will be implemented by existing staff) | Computer and stationery | R100 000 | |||||||
| The municipality is operating an unlicensed waste disposal facility and the waste disposal facility is not managed in an environmentally sound manner | Goal 5: Ensure the safe and proper disposal of waste | Apply for a waste licence in order to have a licenced waste disposal facility | X | Close unlicensed waste disposal facilities and apply for a licence to | Personnel (Project manager) | R500 000 | |||||
| Establish a new waste disposal facility | X | Establish a new waste disposal facility | Personnel (waste disposal facility operators, weigh-bridge operator etc.) | Equipment to run a fully compliant waste disposal facility i.e. trucks, weigh-bridge etc. | R15 000 000 | ||||||
| Train the waste disposal facility manager/operators in order that the disposal facility can be run in accordance with the licence conditions | X | Conduct training for waste disposal facility manager/ weigh-bridge operators | Service provider | Training material | R100 000 | ||||||
| The municipality does not have education and awareness programme or strategy in place | Goal 6: Education and awareness | Recruit environmental/ waste education personnel | X | Appoint education personnel | Personnel (3 additional staff members) | R2 000 000 | |||||
| Develop an education and awareness strategy | X | Develop an education and awareness strategy, internally | Personnel (existing staff members) | Develop material to conduct education, awareness and advocacy | R100 000 | ||||||
| Develop a schools competition programme to encourage school’s involvement on waste management issues i.e. recycling | X | Roll out the education and awareness campaigns i.e. schools competition | Personnel (existing staff members) | (Posters, pamphlets, and media, etc) | R500 000 | ||||||
| There is no law enforcement | Goal 7: Compliance and enforcement | Appoint officials to enforce by-laws | X | Roll out enforcement and monitoring of by-laws | 6 additional personnel | R3 000 000 | |||||
| Enforce by-laws | X | X | X | Enforce by-laws | Personnel (remuneration) | Vehicles Laptops Cell phones |
R500 000 | ||||
This exercise should be performed for all the goals; and what is key to note is that these are according to the desired end state as well as the selected methods of achieving the goals. Once the IWMP has been approved, the implementation plan should be a living document that will be used to deliver day to day waste management services in order that targets set in the IWMP should be met.
5. Approval process
Chapter 3, Section 11 4a (ii) of the Waste Act states that each municipality must include the approved IWMP in its integrated development plan (IDP) as contemplated in chapter 5 of the Municipal System Act for approval by Council. This is to ensure that the approved IWMP is included in the municipal IDP , the goals and targets contained in the IWMP are prioritised and that Council will implement the IWMP. Further, it is also to ensure that waste management services are streamlined with other essential services such as water and sanitation, housing, and electrification.
6. Reporting on implementation, monitoring and review
6.1 Reporting
Section 13 (3) of the Waste Act requires that annual performance reports prepared in terms section 46 of the Municipal System Act must contain information on the implementation of the municipal IWMP, including the information in paragraphs (a) to (j) of subsection (2) insofar as it relates to the performance of the municipality. The information set out in paragraphs (a) to (j) is as follows:
- the extent to which the plan has been implemented during the period;
- the waste management initiatives that have been undertaken during the reporting period;
- the delivery of waste management services and measures taken to secure the efficient delivery of waste management services, if applicable;
- the level of compliance with the plan and any applicable waste management standards;
- the measures taken to secure compliance with waste management standards;
- the waste management monitoring activities;
- the actual budget expended on implementing the plan;
- the measures that have been taken to make any necessary amendments to the plan;
- in the case of a province, the extent to which municipalities comply with the plan and, in the event of any non-compliance with the plan, the reasons for such non-compliance: and
- any other requirements as may be prescribed by the Minister.
Compliance and monitoring:
A municipality should determine whether it has complied with the above requirements on reporting on the implementation of its IWMP. Has it produced the required annual performance reports which states how far it is with regards to attaining the goals and targets as per the IWMP?
6.2 Monitoring and review
(a) Monitoring
A framework by which the plan will be monitored should be developed. This should identify the tasks/ targets and roles and responsibilities in order to ensure implementation. This could comprise the following:
- Strategic issues: delivery on the goals and objectives; measuring delivery with regards to attaining the short-medium and long term goals and objectives
- Performance: how the municipality is doing in relation to the implementation of the entire IWMP including financial matters?
- Public accountability: Are the stakeholders kept abreast on the development of the plan? (Has there been awareness on the IWMP, awareness campaigns, information transfer and public participation?).
An institutional and organisational plan should be formulated; this is intended to guide institutional transformation and re-organisation of support structures for carrying out the IWMP and delivering on the waste management strategic objectives. This plan should include the following:
Make provision for human resource development, and the additional staff required.
The communication and public participation plan should detail the communication and public participation process to ensure that the necessary arrangements are in place for stakeholders to be informed about progress and to feedback into the process for the implementation of the IWMP.
The financial plan should reflect the waste management priorities identified in the development of the IWMP. The annual budget should be based on the medium-term financial and institutional plans in order to direct and manage resources in a focused way, to achieve the goals of the planning process. A plan for raising the revenue to support the implementation should be developed.
The waste management implementation programme should detail the activities to be undertaken, delivery targets and delivery milestones. It will also provide information on project management, responsibilities of officials responsible for the implementation of the IWMP and schedules for project implementation.
(b) Review of IWMPs
The main objective for reviewing the IWMP is to ensure that it is implemented successfully. An IWMP is to be reviewed every five years in line with the IDP requirements. Apart from reviewing the IWMP every five years the annual performance reports should also act as a reviewing mechanism wherein the municipality should evaluate its progress and should take steps in ensuring that it does not lack behind in reaching the goals and targets set out in the implementation plan.
7. References
DWAF, 1998. Waste Management Series, 2nd Edition, Department of Water Affairs and Forestry, Pretoria, 1998.
DEA 2011, Draft Municipal Sector Plan.
DEA - National Domestic collection standards, October 2010.
DEA - Draft National Waste Information regulations, 2012.
DEAT, 1998. EIA Regulations: Implementation of Sections 21, 22 and 26 of the Environmental Conservation Act, Department of Environmental Affairs and Tourism, Pretoria, April 1998.
DEAT, 2000. Programme for the Implementation of the National Waste Management Strategy: Draft Starter Document for Integrated Waste Management Planning, Reference Document, Department of Environmental Affairs and Tourism, Pretoria, May, 2000.
DEAT, 2006, Guideline on the implementing the South African waste information system.
DACERD North West, 2008. Provincial Integrated Waste Management Plan, Department of Agriculture, Conservation, Environment and Rural Development: North West, 2008
DEADP Western Cape, 2005. Guidelines for the development of Integrated waste management plans (IWMP's) for municipalities, Department of Environmental Affairs and Development Planning: Western Cape, 2005
Local Government: Municipal Systems Act, 32 of 2000
UNEP, 2009. Developing Integrated Solid Waste Management Plan, Training manual volume 1. Waste Characterisation and Quantification with Projections for Future
UNEP, 2009. Developing Integrated Solid Waste Management Plan, Training manual volume 2. Assessment of Current Waste management system and Gaps therein
StatsSA, Non-financial census of municipalities for the year ended 30 June 2010
StatsSA 2011, Mid-year growth Estimate report
Annexure A: Typical volumes of vehicles using waste disposal facilities
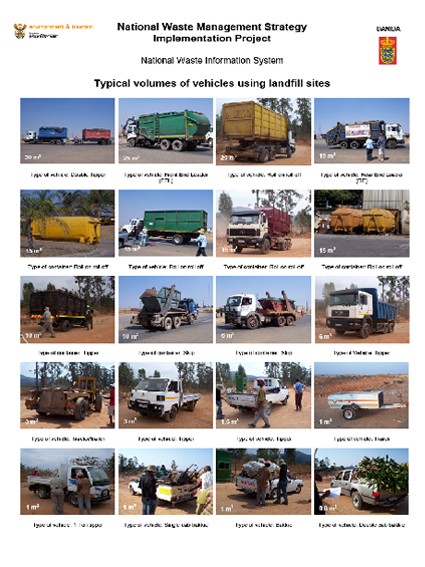
Annexure B: Typical densities of different municipal waste streams
| Waste categorisation | Waste type | Density kg/m3 |
|---|---|---|
| Domestic waste | Domestic waste compacted in REL | 500 |
| Domestic uncompacted | 200 | |
| Mix domestic/garden (more domestic than garden) | 200 | |
| Mix domestic/building rubble (more domestic than building) | 250 | |
| Commercial/Industrial | Commercial/Industrial - packaging (paper and plastics) | 200 |
| Commercial/Industrial - timber/metal | 150 | |
| Tyres | 150 | |
| Inert Waste (Contruction waste) | Building rubble/concrete/sand/ fiber glass/bricks/ceramics | 750 |
| Building rubble/industrial mix (more building than packaging) | 350 | |
| Building/garden mix (more building than garden) | 250 | |
| Garden waste | Loose grass/small branches | 200 |
| Large logs | 400 | |
| Garden/building mix (more garden than building) | 250 | |
| Perishable waste | Food waste/animal fodder | 840 |