2.2 Situation analysis
The main objective of a situation analysis is to analyse and quantify all aspects pertaining to the management of waste within a particular municipality’s boundary (including all types of settlements). It includes the current status with regards to the delivery of waste services, number of residents in that municipality, demographic profile and socio-economic composition. It also includes the amount and type of waste that is being generated, recycled, recovered, treated and disposed. Information on resources i.e. financial and human capital including equipment must also be indicated under this section. Chapter 3 section 12 of the Waste Act stipulates that a situation analysis must at least include the following:
- A description of the population and development profiles of the area to which the plan relates;
- An assessment of the quantities and types of waste that are generated in the area;
- A description of the services that are provided, or that are available, for the collection, minimisation, re-use, recycling, and recovery, treatment and disposal of waste, and
- The number of persons in the area who are not receiving waste collection services
2.2.1 Demographics (population and development profiles)
Demographics can be defined as the most recent statistical characteristics of a population in a given area at a specified time1. The most commonly examined demographics include gender, race, age, economic and social status/profile, number of households and their distribution, poverty levels, education and employment status amongst others.
In relation to waste management, demographics are required to develop projections of current and future waste quantities. In addition this information is required to:
- Ensure that previously un-serviced areas, such as informal settlements and rural or sparsely populated areas are considered;
- Form the basis for projected waste volumes and types;
- Evaluate potential for financial recovery; and
- Assess the required resources to provide waste management services and infrastructure.
The following box provides demographic data/information sources.
Box 1: Example of demographic data sources
Tips on sources of demographic information:
|
Demography also includes fertility, mortality and migration rates. Therefore it is important to also feature in the birth and death rates of the area, how migration in the area is affecting the socio-economic; environment and development dimension patterns of that area.
Information on South Africa's demographics is collected by StatsSA during the Census data collection phase and it is classified according to settlement types. The settlement types are classified according to the following categories:
- High income, low density; 2
- Middle income, middle density;3
- Low income, high density4 (including informal settlements) and
- Rural settlements.
In presenting the description of population and development profile of an area, a municipality must also indicate the population growth estimates of that particular area.
Growth Estimates are available in the latest Mid-year growth Estimate report from StatsSA. Municipalities could make use of the formula supplied in this report to do their calculations. In instances where this information is not readily available, it can then be calculated as follows:
Pt = P0 + B - D + I - E ÷ N
Where Pt represents the current population,
P0 represents the base resident population,
B represents births to resident,
D represents deaths to residents,
I represents immigrants,
E represents emigrants and
N represents number of years
In the equation, the population changes by adding births and immigrants and subtracting deaths and emigrants.
Pt = P0 + B - D + I - E ÷ N
100 000=70 000+20 000-6000+3000-1000 ÷ 10
100 000=90 000-6 000+3 000-1000 ÷ 10
100 000=84 000+3 000-1000 ÷ 10
100 000=87 000-1000 ÷ 10
100 000=86 000 ÷ 10
=8.6% in 10 yrs
=8.6 ÷ 10
=0.86% annually
In this particular area/case6:
Settlement type: High income, low density
The base population in this settlement type category is 100 000 residents and the growth estimates per annum is 0.86% as calculated above. The following examples provide options of how demographic data in relation to settlement types in a given area can be represented. Please note that not all demographic variables have been depicted, only age, gender, employment and education are used.
Table 1: Demographic information for high income, low density settlement
| Type of settlement | Base population | Growth estimates per annum | Population distribution |
|---|---|---|---|
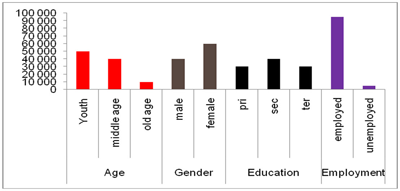
| High income, low density | 100 000 | 0.86% | Age: youth: 50 000, middle age: 40 000, and old age: 10 000 Gender: Male: 40 000, Female: 60 000 Education: Primary: 30 000, Secondary: 40 000, Tertiary: 30 000 Employment: Employed: 95 000 and unemployed: 5 000 |
Graphically the information for this settlement type would be represented as follows:
Graph 1: Demographic information for high income, low density settlement
The second example is of a middle income middle density settlement type
Settlement type: Middle income, middle density
Growth estimates per annum for this settlement type would be:
Calculated as Pt = P0 + B - D + I - E ÷ N
200 000=150 000+20 000-10 000+11 000-9 000 ÷ 10
200 000=170 000-10 000+11 000-9000 ÷ 10
200 000=160 000+11 000-9000 ÷ 10
200 000=171 000-9000 ÷ 10
200 000=162 000 ÷ 10
=16.2% in 10 yrs
=16.2 ÷ 10
=1.62% annually
Table 2: Demographic information for middle income, middle density settlement
| Type of settlement | Base population 7 | Growth estimates per annum | Population distribution |
|---|---|---|---|
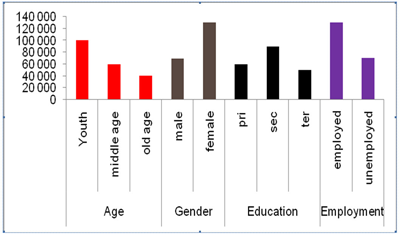
| Middle income, middle density | 200 000 | 1.62% | Age: youth: 100 000, Middle age: 60 000 and Old age: 40 000 Gender: Male: 70 000, Female: 130 000 Education: Primary: 60 000, Secondary: 90 000 and Tertiary: 50 000 Employment: Employed: 130 000 and Unemployed: 70 000 |
Graph 2: Demographic information for middle income, middle density settlement
For low income high density area the population distribution per settlement type would be as follows:
Settlement type: Low income, low density (including informal settlements)
Growth estimates per annum for this settlement type:
Calculated as Pt = P0 + B - D + I - E ÷ N
500 000=350 000+70 000-50 000+20 000-10 000 ÷ 10
500 000=420 000-50 000+20 000-10 000 ÷ 10
500 000=370 000+20 000-10 000 ÷ 10
500 000=390 000-10 000 ÷ 10
500 000=380 000 ÷ 10
=38% in 10 yrs
=38 ÷ 10
=3.8% annually
Table 3: Demographic information for low income, high density (including informal settlements)
| Type of settlement | Base population 7 | Growth estimates per annum | Population distribution |
|---|---|---|---|
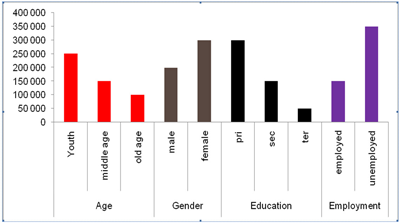
| Low income, high density (including Informal settlements) | 500 000 | 3.8% | Age: Youth: 250 000, Middle age: 150 000 and Old age: 100 000 Gender: Male: 200 000, Female: 300 000 Education: Primary: 300 000, Secondary: 150 000 and Tertiary: 50 000 Employment: Employed: 150 000 and Unemployed: 350 000 |
Graph 3: Demographic information for low income, high density settlement
Settlement type: Rural settlement
Growth estimates per annum for this settlement type:
Calculated as Pt = P0 + B - D + I - E ÷ N
300 000=180 000+70 000-20 000+25 000-5 000 ÷ 10
300 000=250 000-20 000+25 000-5 000 ÷ 10
300 000=230 000+25 000-5 000 ÷ 10
300 000=255 000-5 000 ÷ 10
300 000=250 000 ÷ 10
=25% in 10 yrs
=25 ÷ 10
=2.5% annually
Table 4: Demographic information for rural settlement
| Type of settlement | Base population 7 | Growth estimates per annum | Population distribution |
|---|---|---|---|
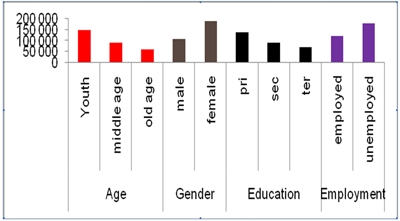
| Rural settlements | 300 000 | 2.5% | Age: Youth: 150 000, Middle age: 90 000 and Old age: 60 000 Gender: Male: 110 000, Female: 190 000 Education: Primary: 140 000, Secondary: 90 000 and Tertiary: 70 000 Employment: Employed: 120 000 and Unemployed: 180 000 |
Graph 4: Demographic information for rural settlement area
- http://en.wikipedia.org/wiki/Demographics
- High income=R1m + a year; low density
- Middle income=R75 000-R999 000 a year, middle density
- Low income=R0 00-R74 999 000 a year, high density
- Wikipedia pop
- Please note that these are just examples aimed to illustrate how this can be calculated and represented in a table as well as in a graph format. The actual information for your particular municipality can be obtained through Census data, Community surveys or municipal surveys.
- Base population and population distribution is taken from the latest available Census for an example if the last Census was in 2001 whatever the population figures were for a particular municipality in 2001 then that would be the base population for that municipality until the next Census.
2.2.2 Waste quantities and types
A municipality must determine the quantities and the types of waste generated in its area of jurisdiction. This involves establishing the current quantities of waste generated, recycled, treated and disposed of. Waste quantities are usually measured by mass (kilograms or tons). This information is needed for:
- Ensuring adequate planning of resources to deliver waste management services;
- Rolling out of waste collection services to the unserviced area as prioritized by government;
- Establishing waste recycling initiatives i.e. buy-back centres which can have positive impacts in the reduction of the amount of recyclables going to landfill, and the establishment of SMME's in waste management which can promote entrepreneurship amongst residents;
- Provision of a certain number of waste receptacles and the establishment of collection needs i.e. how many skips should be provided in communal areas such as shopping centres, clinics and other public areas such as sport clubs; and for implementing separation at source initiatives,
- Ensuring that the municipality procures the correct types of vehicles as well as budgets for the correct number of vehicles that will be required to effectively deliver the service; and
- Making projections of future waste quantities in order to ensure that provision is made for future waste services delivery and the expansion of infrastructure to deliver the service i.e. the information will highlight if there is a need to establish new waste disposal facilities, transfer stations for faster and more effective collection rates.
This information can be collected from the following sources:
- Waste transporters - Municipalities, Private companies
- Waste managers - waste disposal facilities, treatment facilities
- IDP and municipal records
- Waste Information System: The Department of Environmental Affairs (DEA) and some Provinces (i.e. Gauteng and Western Cape) have developed waste information systems (WIS) which can provide valuable information on waste quantities and types.
(a) Waste information collection methods:
A situation analysis must include waste types and quantities of waste generated in a particular area. This information can be collected using the following methods.
Option1: Weighbridge
A municipality can make use of a weighbridge to collect and record the types and quantities of waste entering its waste disposal facility. This information is also required for reporting on the South African Waste Information System (SAWIS).
Using a weighbridge a municipality must record the amounts of waste entering its waste disposal facility, by weighing the vehicles at the point of entry and again on the way out. The difference in the mass of the vehicle between the 'in' and 'out' provides the mass of the waste. A weighbridge operator is required to correctly identify the types of waste disposed of. The data is captured using weighbridge software programmed with spreadsheet software such as Microsoft Excel or a customized weighbridge software that can simultaneously provide billing information based on the type of waste and the size of the vehicle.
Option 2: Without a weighbridge
Making use of the vehicle capacity and the waste densities template (a volume density estimation system)
In instances where a municipality does not have a weighbridge, it can make use of templates that were developed by DEA which are attached hereto as Annexure A and B. These provide guidance on how waste quantities can be estimated for the different waste streams. Annexure A provides a list of typical vehicles used to dispose of waste in waste disposal facilities. This template makes use of estimations (by mass) that have been made based on the size of the vehicles measured in m3. Annexure B contains possible pre-calculated and estimated density values which are based on the type of vehicle carrying a particular pre-classified waste type.
Waste mass estimation system uses a formula that requires waste volume, waste density and waste loading to determine the mass entering a waste disposal facility.
Example of how to calculate waste quantities using commercial/ industrial waste type/s
Formula: waste mass (kg) =vehicle volume (m3) x load/s x waste density (kg/ m3)
If for an example a vehicle has capacity of 10 m3; and the load is 2, with a waste density of 500 m3 the calculations would be as follows:
10 m3x 2 x 500 (kg/ m3) =10 000kg
The waste mass would then be 10 000kg
The capturing of the daily waste data can be recorded as shown in Table 5.
Table 5: An example of a daily waste data collection template
| Name of Landfill: Municipality X | ||||
|---|---|---|---|---|
| Date: 06/12/2011 | ||||
| Client | Vehicle registration no. | Vehicle capacity in m3 | Type of waste | Load |
| B Kumalo | BN 890 GP | 20 | Garden (greens) | 1 |
| R Naidoo | VW 1232 GP | 30 | Building | 1 |
| Sibanye recycling group | BC 682 GP | 50 | Tyres | 2 |
| V James | RT 782 GP | 10 | Building/garden mix | 1 |
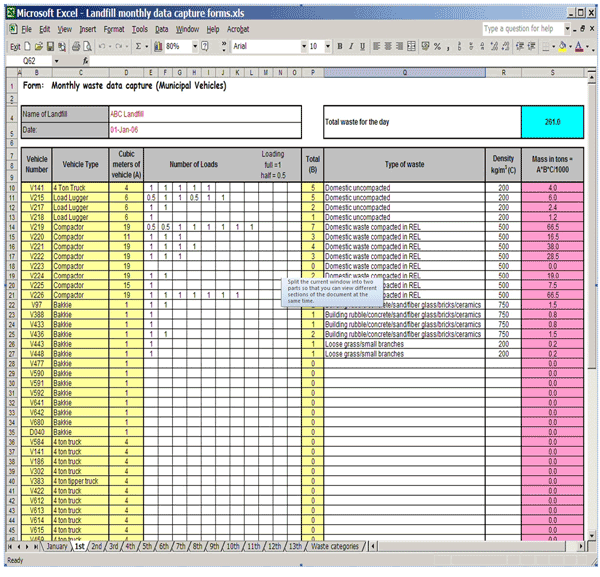
On a monthly basis a municipality must compile a summary of the quantities of waste received and should submit this information to the South Africa Waste Information Centre (SAWIC). DEA has developed data capture forms which comprise of a landfill monthly data capture form as well as a landfill annual data summary form. Using the daily waste data collection form, municipalities are required to enter the information from the daily data capture form into a monthly data form in order to transfer the handwritten data into a spreadsheet. The table below provides an example of how the information is to be captured on a monthly data capture form: NB! This form has already been developed and it is available on SAWIC.
Table 6: An example of a monthly data capture form
Option 3: Sampling or conducting a waste stream analysis at a household/Ward level
Waste stream analysis or a waste audit can be conducted by selecting a representative sample of an area which should at least comprise of 30 %8 of the total sample area. In residential areas, these could be households from different Wards in order to ensure inclusivity and representation. Once that is known, the participating households can then be provided with receptacles and these could be different coloured plastic bags such as a black bag for mixed waste and a clear bag for recyclables. The participating households could also be provided with instructions/ training on the objectives of the study, what is required of them and how the audit will be carried out.
As an example, this could entail explaining to them the different types of commonly found domestic waste streams i.e. Glass, plastic, paper, cardboard, cans and garden waste etc. The participating residents can then be advised to separate their recyclables waste from non-recyclable/mixed waste, if the objective is to also measure the amount of recyclables generated in that area. Once collected, this should be weighed separately in order to gauge the mass of both recyclable waste and non-recyclables. A hand-held scale can be utilised for this purpose wherein the assessors (people employed to carry out the audit) will on the waste collection days or once a week depending on the agreed terms for the study; will individually weigh the waste in order to determine the amount of both recyclables generated in that particular area as well as the weight of non-recyclables.
After obtaining the figures from the participating households/Wards one is then able to extrapolate or estimate the amount of waste that is generated in that particular municipality. This can be done by adding the amounts of recyclables generated in all the areas, and then determine the average recyclables generated as well as by adding up mixed waste to determine their average. The recyclables could even be added up according to the various waste streams i.e. paper, glass, tin, cardboard etc. As illustrated below:
The different waste streams that were predominantly found in this particular area were as follows.
In Ward X, the waste composition and the amount of waste generated for both mixed and recyclable waste was as follows:
Table 7: Summary of waste recording for ward x
| Waste type/streams | Waste generated per week (kg) | Total percentages |
|---|---|---|
| Organic waste | 120 | 44.5% |
| Cans | 60 | 22.2% |
| Paper | 25 | 9.2% |
| Glass | 35 | 12.9% |
| Plastic | 30 | 11.2% |
| Total | 270 | 100% |
An assessor would have to record the types and amounts of waste generated in their study area for a given period of time and would need to write a summary of their findings. In area X the bulk of the waste comprised of organic waste (this included garden waste as well as vegetable peels from the kitchen) which came to 44.5% and from the recycling receptacles, cans were the majority at 22.2% followed by glass at 12.9% and then plastic at 11.2% with paper only making about 9.2% as illustrated above).
The same exercise can be performed for all the households of the different Wards that formed part of the sample size/area and this could even include business areas in order to get a bigger picture of how much waste is generated in that area apart from residential waste.
In order to get a visual description of how much waste is generated in the study area a table or a graph depicting all the different households/Wards that participated in the study could be generated and information from all the surveyed areas could be entered side by side in order to see which of the area/s or Wards in the study area generated the bulk of the waste and what waste streams were the majority.
A waste stream analysis has other benefits such as:
- It will indicate the potential for the establishment of a buy-back centre or the establishment of a Materials recovery facility (MRF).
- Will determine the current waste practices i.e. whether there is recycling taking place or illegal dumping.
Once the waste analysis results are known, they will assist in improving the current state of affairs with regards to waste management i.e. provision of waste management receptacles, establishment of separation at source programmes and recycling initiatives.
(b) Reporting to SAWIS
The Department has developed waste information regulations in terms of section 69(1) (y) and (ee) of the Waste Act that incorporated waste categorisation in order to regulate the collection and reporting of waste data and information to the SAWIS. The following table provides information on the categories/types of waste that should be reported to the SAWIS.
Table 8: General waste types categorisation
| Level 1 | Level 2 - Major Waste Type | Level 3 - Specific Waste Type | ||
| No | Name | No | Name | |
| GW 01 | Municipal waste | 01 | ||
| GW10 | Commercial and industrial waste | 01 | ||
| GW13 | Brine | 01 | ||
| GW14 | Fly ash and dust from miscellaneous filter sources | 01 | ||
| GW15 | Bottom ash | 01 | ||
| GW16 | Slag | 01 | ||
| 02 | Non-ferrous metal slag | |||
| 03 | Other | |||
| GW17 | Mineral waste | 01 | Foundry sand | |
| 02 | Refractory waste | |||
| 03 | Other | |||
| GW18 | Waste of Electric and Electronic Equipment (WEEE) | 01 | Large Household Appliances | |
| 02 | Small Household Appliances | |||
| 03 | Office, information & Communication Equipment | |||
| 04 | Entertainment & Consumer Electronics and toys, leisure, sports & recreational equipment and automatic issuing machines | |||
| 05 | Lighting equipment | |||
| 06 | Electric and Electronic tools | |||
| 07 | Security & health care equipment | |||
| 08 | Mixed WEEE | |||
| GW20 | Organic waste | 01 | Garden waste | |
| 02 | Food waste | |||
| GW21 | Sewage sludge | 01 | Sewage sludge | |
| GW30 | Construction and demolition waste | 01 | ||
| GW50 | Paper | 01 | Newsprint and magazines | |
| 02 | Brown grades | |||
| 03 | White grades | |||
| 04 | Mixed grades | |||
| GW51 | Plastic | 01 | PET | |
| 02 | Others | |||
| GW52 | Glass | 01 | ||
| GW53 | Metals | 01 | Ferrous metal | |
| 02 | Non-ferrous metal | |||
| GW54 | Tyres | 01 | ||
| GW99 | Other | 01 | ||
Once the information on the types and quantities of waste generated in a particular municipality has been collected the municipality can either enter its information directly to SAWIC at www.sawic.org.za or it could manually provide its information to a Provincial waste information officer who will then enter the information on its behalf to SAWIC.
- Taken from StatsSA: general guide for sampling, this implies that in a given area the sample size should at least be 30% of the total population
2.2.3 Determining current domestic waste generation per capita
Estimations on the amount of waste generated can be calculated per week, per month or per year. The 2006 State of the Environment Report (SOER) indicated that South Africa generated 42 million m3 of solid waste per year. This amounted to 0,7kg's per person per day. The generation rates were further broken down into generation rates per income category and the results were as follows:
- Low income= 0.41kg/per person/day or (0.41kgx365 days)=149.65kg/person/year
- Middle income=0.74kg/per person/day or (0.74kgx 365days) = 270.1kg/person/year
- High income= 1.29kg/person/day or (1.29kgx365days) = 470.85kg/person/year
Linking to the table on demographic information under section 2.1.1, and having calculated the current waste generation rates a municipality can then add a column which estimates the current domestic waste generation per capita as illustrated below. In this instance, an assumption is made that the current waste domestic generation rates are according to the 2006, SOER figures and it is classified according to settlement types.
Table 9: Determining current domestic waste generation rates per capita
| Type of settlement | Base population | Growth estimates9 | Population distribution | Current domestic waste generation rates per capita10 (per year in kg's11) |
|---|---|---|---|---|
| High income, low density | 100 000 | 0.86% per annum | Age: youth: 50 000, middle age: 40 000 and old age: 10 00012 Gender: male: 40 000 , female: 60 000 Education: primary: 30 000 , secondary: 40 000 and tertiary: 30 000 |
100 000x470.85 kg = 47 085 000 kg's/person/year Then convert to tons: 47 085 000÷1000 = 47 085 tons |
| Middle income, middle density | 200 000 | 1.62% per annum | Age: youth: 100 000, middle age: 60 000 and old age: 40 000 Gender: male:70 000 , female: 130 000 Education: primary: 60 000, secondary: 90 000 and tertiary: 50 000 |
200 000x 270.1kg = 54 020 000 kg's/person/year Then convert to tons: 54 020 000÷1000 = 54 020 tons |
| Low income, high density (including Informal settlements) | 500 000 | 3.8% per annum | Age: youth: 250 000, middle age: 150 00 and old age: 100 000 Gender: male: 200 000, female: 300 000 Education: primary: 300 000, secondary: 150 000 and tertiary: 50 000 |
500 000x 149.65kg= 74 825 000 kg's person/year Then convert to tons: 74 825 000 ÷ 1000 = 74 825 tons |
| Rural settlements | 300 000 | 2.5% per annum | Age: youth: 150 000, middle age: 90 000 and old age: 60 000 Gender: male: 110 000, female: 190 000 Education: primary: 140 000, secondary: 90 000 and tertiary: 70 000 |
300 000x 149.65kg = 44 895 000 kg's person/year Then convert to tons: 44 895 000 ÷ 1000 = 44 895 tons |
- According to the Mid year growth Estimate report StatsSA 2011
- 2006 State of the Environment Report : low income=0.41kg/person/day
Middle income=0.74kg/person/day
high income=1.29kg/person/day - 1000 kg=1 ton
- Age-Youth=0-35yrs; Middle age=36-60; old age >61
2.2.4 Estimating future waste generation rates and quantities
Future waste trends, in terms of quantities for the planning period should be estimated using the information collected on the domestic waste generation rates per capita for each socio-economic category/types i.e. the population, population distribution, and commercial and industrial waste generation rates.
In this instance, the information is taken as it is from section 2.1.1.under demographics. What has changed is that calculations were made to determine what the future population growth rates would be wherein an assumption has been made that if the growth estimates remained constant for the next 10 years and the per capita waste generation rates also remained constant (as what they were in the 2006 SOER) then results would be as follows:
Table 10: Estimation of future waste generation rates and quantities
| Type of settlement | Base population | Growth estimates13 | Population distribution | Current domestic waste generation rates per capita14 | Future15 domestic waste generation rates per capita (in 10 years) |
|---|---|---|---|---|---|
| High income, low density | 100 000 | 0.86% per annum | Age: youth: 50 000, middle age: 40 000 and old age: 10 00016 Gender: male: 40 000 , female: 60 000 Education: primary: 30 000 , secondary: 40 000 and tertiary: 30 000 |
100 000x470.85 kg = 47 085 000 kg's/ person/year | 108 600 x 470.85kg/person/year = 51 134 310 kg's /person/year Then convert to tons: 51 134 310 ÷ 1000=51134.31 tons |
| Middle income, middle density | 200 000 | 1.62% | Age: youth: 100 000, middle age: 60 000 and old age: 40 000 Gender: male:70 000 , female: 130 000 Education: primary: 60 000, secondary: 90 000 and tertiary: 50 000 |
200 000x 270.1kg = 54 020 000 kg's/person/year | 232400x 270.1kg/person/year= 62771240kg's/person/year Then convert to tons: 62771240 ÷ 1000=62771.24. tons |
| Low income, high density (including Informal settlement) | 500 000 | 3.8% | Age: youth: 250 000, middle age: 150 00 and old age: 100 000 Gender: male: 200 000, female: 300 000 Education: primary: 300 000, secondary: 150 000 and tertiary: 50 000 |
500 000x 149.65kg= 74825 000 kg's person/year | 690 000x149.65kg=103 258 500 kg/person/year Then convert to tons: 103 258 500 ÷ 1000=103258.5 tons |
| Rural settlements | 300 000 | 2.5% | Age: youth: 150 000, middle age: 90 000 and old age: 60 000 Gender: male: 110 000, female: 190 000 Education: primary: 140 000, secondary: 90 000 and tertiary: 70 000 |
300 000x 149.65kg=44895 000 kg's person/year | 375 000x149.65kg= 561 187 50 kg's/person/year Then convert to tons: 561 187 50 ÷ 1000=56118.75 tons |
- Assuming that the population growth rates will remain constant for the next 10 years
- Assuming that the per capita waste generation rates would be according to the 2006 State of the Environment Report for all income categories:
low income=0.41kg/person/day Middle income=0.74kg/person/day,
high income=1.29kg/person/day - 10 years time assuming that the waste generation rates would be according to the 2006 State of Environment figures.
- Age-Youth=0-35yrs; Middle age=36-60; old age >61
2.2.5 Waste recycling, treatment and disposal
(a) Waste recycling
This section entails the identification of existing recycling initiatives and it must be indicated whether these are recycling initiatives by the municipality or industry lead. This can be for the various waste streams such as paper, glass, plastic, metal or even composting and these could even be community run initiatives through private individuals, co-operatives/recycling groups including NGO's. The available recycling infrastructure such as buy-back centres, Materials Recovery facilities should be identified in order for the municipality to publicise these through education and advocacy to ensure maximum participation by the residents.
Established recycling facilities should be described for each local authority, as follows:
- Existing recycling facilities (name of the facility, location, the capacity i.e. can process so many tonnes of waste per month, treatment, age, etc.);
- Commodities recycled (e.g. waste paper, cans, plastic and glass); and
- Quantities of waste recovered
(b) Treatment and Disposal
Municipalities should keep a record of waste disposal facilities under their area of jurisdiction and should indicate the status of these waste disposal facilities (i.e. whether they are licensed or unlicensed) including treatment facilities for hazardous waste (even if they are owned and operated by the private sector). Municipalities are required to ensure that waste is properly managed and disposed of according to Waste license conditions. It is also important that municipalities must establish the size of their waste disposal facilities; the anticipated lifespan and/ or available airspace, types and quantities of waste disposed, and should take note of whether these are operated in a sound and environmentally acceptable manner.
(i) Determining available airspace at waste disposal facilities
Determining the available waste disposal facilities' airspace assists in understanding the amount of waste that can still be accepted as well as in knowing the remaining airspace. Importantly, it will assist a municipality to plan for the future i.e. if the waste disposal is almost near its end of life then a municipality could be proactive by lodging the necessary applications to obtain a license for a new waste disposal facility, and or secure funding for upgrading the existing waste disposal facility/ies or securing funding to construct new ones.In order to determine the available waste disposal facility's airspace, various methods can be employed. Topographical method is one of them. Using the topographical method in determining the remaining capacity of a waste disposal facility; a municipality needs to know the current and final capacity of the currently licensed waste disposal facility. According to this method, the current and final capacity of the waste disposal facility is used to determine the current and final volumes. The remaining capacity is calculated using the final capacity/volumes minus the existing capacity/volumes, for example:
Final capacity-Existing capacity= Remaining Capacity
If a waste disposal facility has a final capacity of 500 000m3 and the existing capacity is 300 000m3 then the remaining capacity would be 200 000 m3 calculated as follows:
500 000m3-300 000m3=200 000m3
In instances where there is no information available to determine airspace/capacity in a given municipality; it can be obtained from the following sources:
Box 2: Sources of information for determining the available waste disposal facilities capacity
Sources of waste disposal facilities capacity information:
|
The following table provides an example of how this information can be recorded in instances where there are more than one waste disposal facilities in a given municipality.
Table 11: Status quo of waste disposal facilities in a particular municipality
| Name/s of Disposal site/s | Status | Total capacity | Available waste disposal facility/ies airspace |
|---|---|---|---|
| Vondeling waste disposal site | Licensed | 2,500 000 m3 | 1,500 000 m3 |
| Giyani Waste disposal facility | Unlicensed | 2,000 000 m3 | 1, 350 000 m3 |
2.2.6 Status of waste collection services
(Number of persons not receiving a waste collection service)
A list containing areas that receive a waste collection service and areas that do not receive waste services should be developed. For indigent households, municipalities are required to register indigent households on an indigent register and should ensure that it is kept up to date. The National Domestic Waste Collection Standards can be used as a guideline on the acceptable collection standards for the different settlement types. Further a municipality needs to develop a plan on how it will roll out waste collection services in the different settlement types. For example, different methods could be employed to deliver the service such as making use of the community based collection model in areas that are densely populated using local labour and so forth. A municipality also needs to develop an inventory of its own resources being it financial, infrastructure and human resources in order to highlight how it will deal with providing the service to indigent households and if new establishments are constructed, how it will deal and cope with such expansion.
Table 12: Status of waste collection services per settlement type
| Settlement type | Total households | Total no. of serviced households | Total no. of unserviced households | Total indigent households (taken from total households) | Total unserviced indigents households (taken from total unserviced households) |
|---|---|---|---|---|---|
| High income, low density | 1000 | 1000 | 0 | 0 | 0 |
| Middle income, middle density | 100 000 | 60 000 | 40 000 | 10 000 | 5000 |
| Low income, high density (including Informal settlement) | 200 000 | 100 000 | 100 000 | 40 000 | 40 000 |
| Rural settlements | 300 000 | 50 000 | 250 000 | 170 000 | 170 000 |
The delivery of waste collection services to indigent households as well as rolling out services to previously un-serviced areas could be listed as one of the strategic goals of a municipality. Attaining this target could be achieved through listing the goals and targets in the implementation plan to ensure that it will be prioritised.
(i) Collection needs
It is crucial to establish the extent of collection services provided by the municipality as well as the collection routes in a geographical area or in municipal demarcated collection regions. This can be achieved through mapping the collection routes/areas in order to ascertain the proximity of waste collection routes to the waste disposal sites in order to ensure efficiency and fast turnaround times.
Box 3: Mapping the geographic waste management area
|
Tip on mapping the geographic waste management area A map depicting collection and transportation routes, recycling depots and the location of the disposal facilities or sites should be developed. This information will indicate where there is a need to establish transfer stations and in order to optimise the sites for recycling, and disposal facilities. This map could be a conventional drawing or can be generated by geographic information system (GIS) software and/or generated using a recent Google earth map. If a municipality does not have the GIS system or internet connectivity to download a Google map, it should consult its Town and regional planning division as this unit keeps copies of municipal maps. |
Box 4: Information on the status of waste collection services
Sources of information for waste collection data:
|
By establishing collection routes, a municipality would be able to properly plan for collection and disposal of waste to and from households to the waste disposal facility/ies, at the same time this information could also be used to gauge whether there is a need to develop transfer stations especially where there are vast travel differences between the collection points and the disposal points in order to save on time and financial resources.
2.2.7 Financing of waste management
(a) Budgeting for waste services
The Municipal Systems Act, Act no. 32 of 2000 (Chapter 8, ss73-86A) requires that municipalities must ensure proper budgeting in order that they are able to deliver on their Constitutional mandate with regards to the provision of waste services. In order for a municipality to successfully implement its IWMP, it is important to establish the current available resources in terms of finance; human resources, technical skills to deliver on the municipality's mandate and to implement the goals and targets contained in the plan i.e. development of by-laws and lastly, funding for operational and maintenance costs for equipment for the effective delivery of waste services and establishment of waste disposal facilities. Further, financial management/budgeting is key as it will assist in identifying future resource needs i.e. if there is an increase in the number of households requiring waste collection services what additional resources will be required to deliver the service. A typical budget includes the following information:
Table13: Examples of categories of waste management cost drivers
| Item | Amount per annum | |
|---|---|---|
| Collection | Transportation | R700 000 |
| Capex-purchase (vehicles) | R400 000 | |
| Maintenance | R100 000 | |
| Fuel | R150 000 | |
| Receptacles | R50 000 | |
| General | R25 000 | |
| Recyclables | R25 000 | |
| Governance | Staff (remuneration) | R1 000 000 |
| Education and awareness | R500 000 | |
| IWMPS | R500 000 | |
| Disposal | By-laws | R500 000 |
| Transfer station | R300 000 | |
| Disposal sites | R10 000 000 | |
| Acquisition of land, equipment | R5 000 000 | |
| Regulatory compliance, EIA's and licence | R5 000 000 |
Table 14: Summary of the budget
| Item | Total amount |
|---|---|
| Collection | R700 000 |
| Governance | R2 500 000 |
| Disposal | R10 300 000 |
The available income/revenue should be listed and the sources of income must also be indicated. Of importance is that a municipality should determine how much revenue is generated in a given year and it should keep record of income and expenditure for compliance reasons (MFMA).
(b) Organisational and institutional matters
Under this section, a municipality must indicate its current organizational structure or organogram in order to determine the available human resources to deliver waste services. The organogram will highlight the number of available staff under each section such as staff to perform management duties, planning, waste collection, recycling and disposal, and enforcement etc. Further an organizational structure could potentially be used to evaluate gaps in areas where there are new functions that must be performed in order to fulfill the Waste Act's requirements. An example of an organogram is illustrated below:
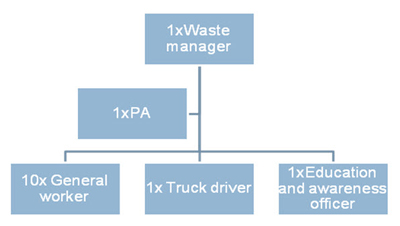
Figure 3: Current organogram
If the above was an organogram of a particular municipality, then that municipality would require additional capacity in order to be able to meet the Waste Act's requirements which amongst others include the development of by-laws, enforcement of by-laws (designation of EMI's), a waste disposal facility manager to manage its waste disposal facility according to the Waste license and supervisors to supervise general workers. Staff shortages can be addressed as one of the goals/targets under the implementation plan as the successful implementation of an IWMP lies in the availability of staff to deliver on the municipality's mandate.