2.2.1 Demographics (population and development profiles)
Demographics can be defined as the most recent statistical characteristics of a population in a given area at a specified time1. The most commonly examined demographics include gender, race, age, economic and social status/profile, number of households and their distribution, poverty levels, education and employment status amongst others.
In relation to waste management, demographics are required to develop projections of current and future waste quantities. In addition this information is required to:
- Ensure that previously un-serviced areas, such as informal settlements and rural or sparsely populated areas are considered;
- Form the basis for projected waste volumes and types;
- Evaluate potential for financial recovery; and
- Assess the required resources to provide waste management services and infrastructure.
The following box provides demographic data/information sources.
Box 1: Example of demographic data sources
Tips on sources of demographic information:
|
Demography also includes fertility, mortality and migration rates. Therefore it is important to also feature in the birth and death rates of the area, how migration in the area is affecting the socio-economic; environment and development dimension patterns of that area.
Information on South Africa's demographics is collected by StatsSA during the Census data collection phase and it is classified according to settlement types. The settlement types are classified according to the following categories:
- High income, low density; 2
- Middle income, middle density;3
- Low income, high density4 (including informal settlements) and
- Rural settlements.
In presenting the description of population and development profile of an area, a municipality must also indicate the population growth estimates of that particular area.
Growth Estimates are available in the latest Mid-year growth Estimate report from StatsSA. Municipalities could make use of the formula supplied in this report to do their calculations. In instances where this information is not readily available, it can then be calculated as follows:
Pt = P0 + B - D + I - E ÷ N
Where Pt represents the current population,
P0 represents the base resident population,
B represents births to resident,
D represents deaths to residents,
I represents immigrants,
E represents emigrants and
N represents number of years
In the equation, the population changes by adding births and immigrants and subtracting deaths and emigrants.
Pt = P0 + B - D + I - E ÷ N
100 000=70 000+20 000-6000+3000-1000 ÷ 10
100 000=90 000-6 000+3 000-1000 ÷ 10
100 000=84 000+3 000-1000 ÷ 10
100 000=87 000-1000 ÷ 10
100 000=86 000 ÷ 10
=8.6% in 10 yrs
=8.6 ÷ 10
=0.86% annually
In this particular area/case6:
Settlement type: High income, low density
The base population in this settlement type category is 100 000 residents and the growth estimates per annum is 0.86% as calculated above. The following examples provide options of how demographic data in relation to settlement types in a given area can be represented. Please note that not all demographic variables have been depicted, only age, gender, employment and education are used.
Table 1: Demographic information for high income, low density settlement
| Type of settlement | Base population | Growth estimates per annum | Population distribution |
|---|---|---|---|
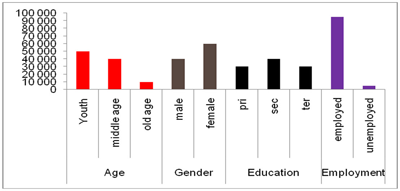
| High income, low density | 100 000 | 0.86% | Age: youth: 50 000, middle age: 40 000, and old age: 10 000 Gender: Male: 40 000, Female: 60 000 Education: Primary: 30 000, Secondary: 40 000, Tertiary: 30 000 Employment: Employed: 95 000 and unemployed: 5 000 |
Graphically the information for this settlement type would be represented as follows:
Graph 1: Demographic information for high income, low density settlement
The second example is of a middle income middle density settlement type
Settlement type: Middle income, middle density
Growth estimates per annum for this settlement type would be:
Calculated as Pt = P0 + B - D + I - E ÷ N
200 000=150 000+20 000-10 000+11 000-9 000 ÷ 10
200 000=170 000-10 000+11 000-9000 ÷ 10
200 000=160 000+11 000-9000 ÷ 10
200 000=171 000-9000 ÷ 10
200 000=162 000 ÷ 10
=16.2% in 10 yrs
=16.2 ÷ 10
=1.62% annually
Table 2: Demographic information for middle income, middle density settlement
| Type of settlement | Base population 7 | Growth estimates per annum | Population distribution |
|---|---|---|---|
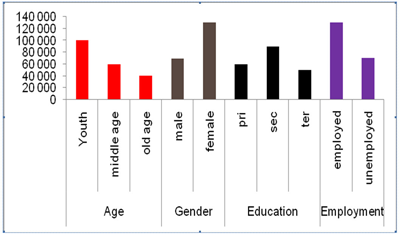
| Middle income, middle density | 200 000 | 1.62% | Age: youth: 100 000, Middle age: 60 000 and Old age: 40 000 Gender: Male: 70 000, Female: 130 000 Education: Primary: 60 000, Secondary: 90 000 and Tertiary: 50 000 Employment: Employed: 130 000 and Unemployed: 70 000 |
Graph 2: Demographic information for middle income, middle density settlement
For low income high density area the population distribution per settlement type would be as follows:
Settlement type: Low income, low density (including informal settlements)
Growth estimates per annum for this settlement type:
Calculated as Pt = P0 + B - D + I - E ÷ N
500 000=350 000+70 000-50 000+20 000-10 000 ÷ 10
500 000=420 000-50 000+20 000-10 000 ÷ 10
500 000=370 000+20 000-10 000 ÷ 10
500 000=390 000-10 000 ÷ 10
500 000=380 000 ÷ 10
=38% in 10 yrs
=38 ÷ 10
=3.8% annually
Table 3: Demographic information for low income, high density (including informal settlements)
| Type of settlement | Base population 7 | Growth estimates per annum | Population distribution |
|---|---|---|---|
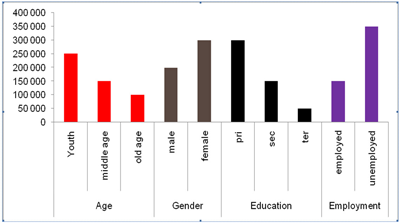
| Low income, high density (including Informal settlements) | 500 000 | 3.8% | Age: Youth: 250 000, Middle age: 150 000 and Old age: 100 000 Gender: Male: 200 000, Female: 300 000 Education: Primary: 300 000, Secondary: 150 000 and Tertiary: 50 000 Employment: Employed: 150 000 and Unemployed: 350 000 |
Graph 3: Demographic information for low income, high density settlement
Settlement type: Rural settlement
Growth estimates per annum for this settlement type:
Calculated as Pt = P0 + B - D + I - E ÷ N
300 000=180 000+70 000-20 000+25 000-5 000 ÷ 10
300 000=250 000-20 000+25 000-5 000 ÷ 10
300 000=230 000+25 000-5 000 ÷ 10
300 000=255 000-5 000 ÷ 10
300 000=250 000 ÷ 10
=25% in 10 yrs
=25 ÷ 10
=2.5% annually
Table 4: Demographic information for rural settlement
| Type of settlement | Base population 7 | Growth estimates per annum | Population distribution |
|---|---|---|---|
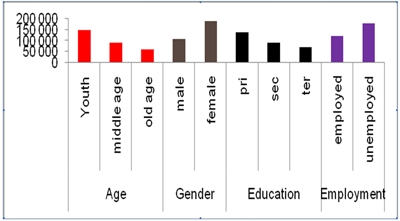
| Rural settlements | 300 000 | 2.5% | Age: Youth: 150 000, Middle age: 90 000 and Old age: 60 000 Gender: Male: 110 000, Female: 190 000 Education: Primary: 140 000, Secondary: 90 000 and Tertiary: 70 000 Employment: Employed: 120 000 and Unemployed: 180 000 |
Graph 4: Demographic information for rural settlement area
- http://en.wikipedia.org/wiki/Demographics
- High income=R1m + a year; low density
- Middle income=R75 000-R999 000 a year, middle density
- Low income=R0 00-R74 999 000 a year, high density
- Wikipedia pop
- Please note that these are just examples aimed to illustrate how this can be calculated and represented in a table as well as in a graph format. The actual information for your particular municipality can be obtained through Census data, Community surveys or municipal surveys.
- Base population and population distribution is taken from the latest available Census for an example if the last Census was in 2001 whatever the population figures were for a particular municipality in 2001 then that would be the base population for that municipality until the next Census.